Bitget:全球日交易量排名前 4!
BTC 市占率61.39%
Bitget 新幣上架 : Pi Network
BTC/USDT$82736.49 (+0.17%)恐懼與貪婪指數34(恐懼)
山寨季指數:0(比特幣季)
盤前交易幣種PAWS,WCT比特幣現貨 ETF 總淨流量:-$93.2M(1 天);+$445.2M(7 天)。Bitget 新用戶立享 6,200 USDT 歡迎禮包!立即領取
到 Bitget App 隨時隨地輕鬆交易!立即下載
Bitget:全球日交易量排名前 4!
BTC 市占率61.39%
Bitget 新幣上架 : Pi Network
BTC/USDT$82736.49 (+0.17%)恐懼與貪婪指數34(恐懼)
山寨季指數:0(比特幣季)
盤前交易幣種PAWS,WCT比特幣現貨 ETF 總淨流量:-$93.2M(1 天);+$445.2M(7 天)。Bitget 新用戶立享 6,200 USDT 歡迎禮包!立即領取
到 Bitget App 隨時隨地輕鬆交易!立即下載
Bitget:全球日交易量排名前 4!
BTC 市占率61.39%
Bitget 新幣上架 : Pi Network
BTC/USDT$82736.49 (+0.17%)恐懼與貪婪指數34(恐懼)
山寨季指數:0(比特幣季)
盤前交易幣種PAWS,WCT比特幣現貨 ETF 總淨流量:-$93.2M(1 天);+$445.2M(7 天)。Bitget 新用戶立享 6,200 USDT 歡迎禮包!立即領取
到 Bitget App 隨時隨地輕鬆交易!立即下載


RED TOKEN 價格RED
未上架
報價幣種:
TWD
數據來源於第三方提供商。本頁面和提供的資訊不為任何特定的加密貨幣提供背書。想要交易已上架幣種? 點擊此處
NT$0.005776-28.10%1D
價格走勢圖
最近更新時間 2025-03-31 20:44:45(UTC+0)
市值:NT$37,549,405.83
完全稀釋市值:NT$37,549,405.83
24 小時交易額:NT$110,335,926.7
24 小時交易額/市值:293.84%
24 小時最高價:NT$0.008102
24 小時最低價:NT$0.005696
歷史最高價:NT$1.04
歷史最低價:NT$0.{4}4119
流通量:6,500,834,300 RED
總發行量:
100,000,000,000RED
流通率:6.00%
最大發行量:
--RED
以 BTC 計價:0.{8}2099 BTC
以 ETH 計價:0.{7}9487 ETH
以 BTC 市值計價:
NT$8,400.32
以 ETH 市值計價:
NT$1,130.07
合約:
0xc744...308a326(Ethereum)
您今天對 RED TOKEN 感覺如何?
注意:此資訊僅供參考。
RED TOKEN 今日價格
RED TOKEN 的即時價格是今天每 (RED / TWD) NT$0.005776,目前市值為 NT$37.55M TWD。24 小時交易量為 NT$110.34M TWD。RED 至 TWD 的價格為即時更新。RED TOKEN 在過去 24 小時內的變化為 -28.10%。其流通供應量為 6,500,834,300 。
RED 的最高價格是多少?
RED 的歷史最高價(ATH)為 NT$1.04,於 2022-09-16 錄得。
RED 的最低價格是多少?
RED 的歷史最低價(ATL)為 NT$0.{4}4119,於 2025-03-04 錄得。
RED TOKEN 價格預測
RED 在 2026 的價格是多少?
根據 RED 的歷史價格表現預測模型,預計 RED 的價格將在 2026 達到 NT$0.007939。
RED 在 2031 的價格是多少?
2031,RED 的價格預計將上漲 +8.00%。 到 2031 底,預計 RED 的價格將達到 NT$0.01113,累計投資報酬率為 +31.70%。
RED TOKEN 價格歷史(TWD)
過去一年,RED TOKEN 價格上漲了 +2769.26%。在此期間, 兌 TWD 的最高價格為 NT$0.03978, 兌 TWD 的最低價格為 NT$0.{4}4119。
時間漲跌幅(%) 最低價最高價
最低價最高價 24h-28.10%NT$0.005696NT$0.008102
7d-49.06%NT$0.004690NT$0.03978
30d+8539.80%NT$0.{4}4119NT$0.03978
90d+8110.89%NT$0.{4}4119NT$0.03978
1y+2769.26%NT$0.{4}4119NT$0.03978
全部時間-98.42%NT$0.{4}4119(2025-03-04, 28 天前 )NT$1.04(2022-09-16, 2 年前 )
RED TOKEN 市場資訊
RED TOKEN 持幣分布集中度
巨鯨
投資者
散戶
RED TOKEN 地址持有時長分布
長期持幣者
游資
交易者
coinInfo.name(12)即時價格表

RED TOKEN 評級
社群的平均評分
4.4
此內容僅供參考。
RED TOKEN (RED) 簡介
揭秘RED TOKEN代幣:一種對前瞻性加密貨幣的探討
隨著科技的持續進步,數位貨幣在全球各地獲得了廣泛的認可。其中,RED TOKEN已經成為當今最引人注目的加密貨幣之一。但是,這究竟是什麼?它的作用和影響又是什麼?以下内容將對這種新興的數位貨幣做一個深入的探討。
RED TOKEN: 新興的密碼貨幣
RED TOKEN是一種基於區塊鏈技術的加密貨幣,由於其獨特的特性和巨大的潛力,這種新型貨幣已經引起了全球範圍內的廣泛關注。它不受任何政府的監管,這使得它可以成為一個真正的全球經濟體系的一部分。
什麼是RED TOKEN的作用?
RED TOKEN的獨特功能是其區塊鏈背後的技術基礎,其創新的技術設計允許用戶實現安全且隱私保護的在網路上的交易。此外,它的去中心化特性讓每個人都能夠參與到這個網路中,並讓他們可以在全球任何地方花費和接收RED TOKEN。
RED TOKEN對未來有何影響?
RED TOKEN不僅是一種揭示了加密貨幣潛力的數位貨幣,更是一種引領全球金融市場向未來發展的標誌。看起來,這種新型貨幣的出現,必將改變我們對全球經濟運作的理解,並為我們每一個人打開一扇前往新金融時代的大門。其中的可能性就像是一個開放的秘密,等待著我們去探索。
RED TOKEN的崛起是一個我們不可忽視的現象,它的出現將對全球經濟產生深遠的影響。這是一個創新的開始,我們只能期待它將帶來絕無僅有的變革。
隨著RED TOKEN數位貨幣的流行,將有越來越多的人開始關注和投資。RED TOKEN無疑是我們進入新的數位經濟時代的一個重要象徵,它帶來的改變將遠超我們的想像。
RED 兌換當地法幣匯率表
1 RED 兌換 MXN$01 RED 兌換 GTQQ01 RED 兌換 CLP$0.161 RED 兌換 UGXSh0.641 RED 兌換 HNLL01 RED 兌換 ZARR01 RED 兌換 TNDد.ت01 RED 兌換 IQDع.د0.231 RED 兌換 TWDNT$0.011 RED 兌換 RSDдин.0.021 RED 兌換 DOP$0.011 RED 兌換 MYRRM01 RED 兌換 GEL₾01 RED 兌換 UYU$0.011 RED 兌換 MADد.م.01 RED 兌換 AZN₼01 RED 兌換 OMRر.ع.01 RED 兌換 KESSh0.021 RED 兌換 SEKkr01 RED 兌換 UAH₴0.01
- 1
- 2
- 3
- 4
- 5
最近更新時間 2025-03-31 20:44:45(UTC+0)
RED TOKEN 動態

RedStone澄清:未與Web3Port和Whisper合作
Bitget•2025-03-20 05:54
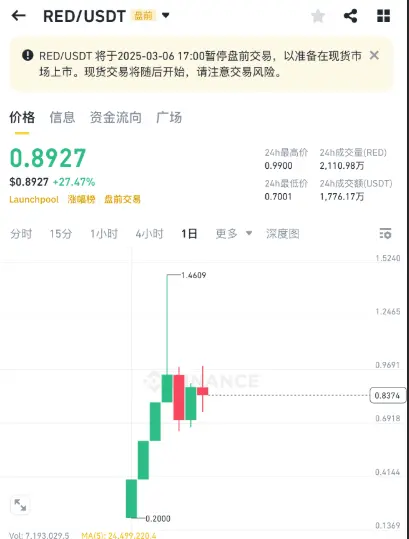
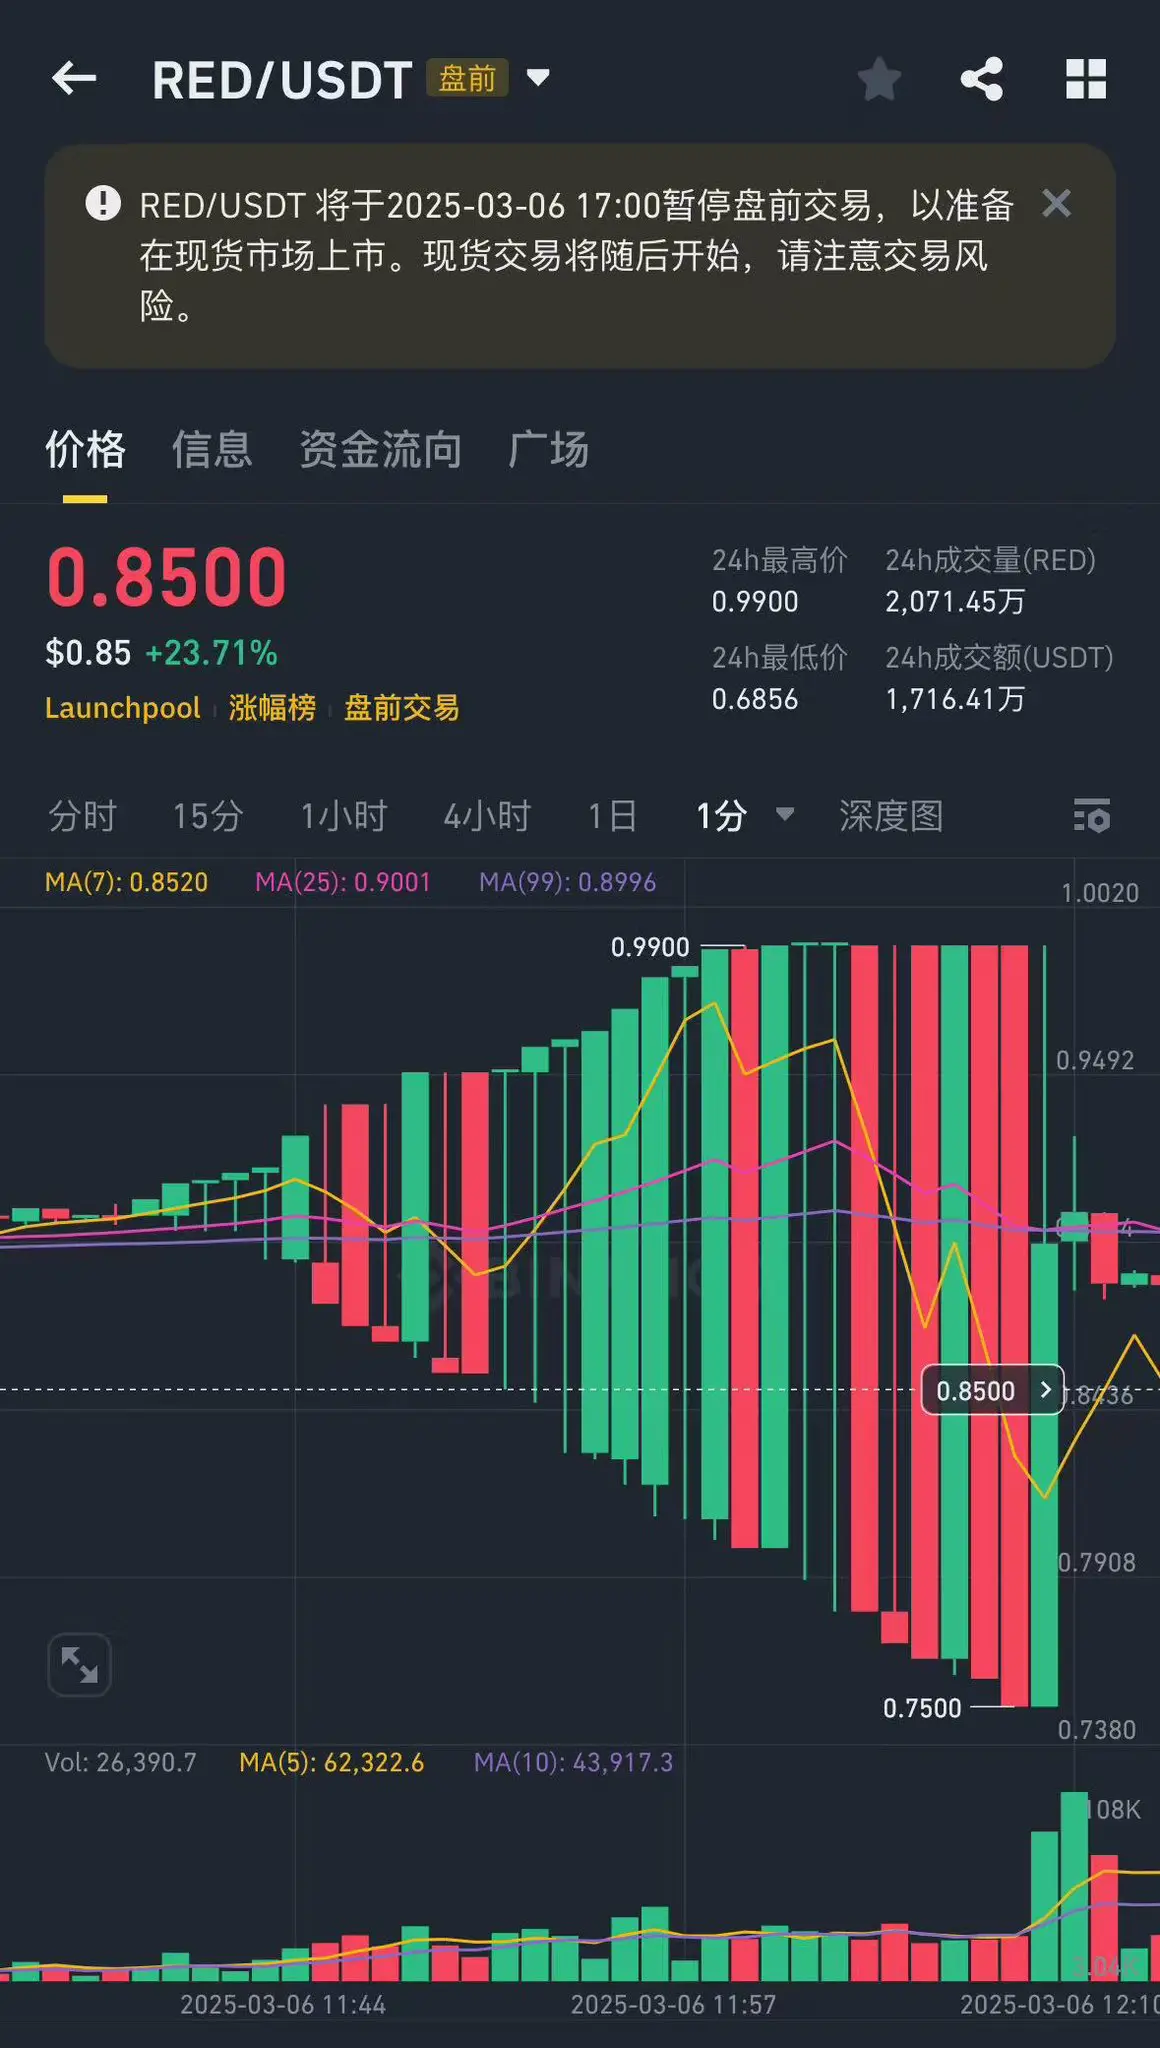
RED短暫突破0.85美元
Bitget•2025-03-15 19:38
Bitget x RED 嘉年華:瓜分 79,500 RED
Bitget Announcement•2025-03-07 05:00

購買其他幣種


用戶還在查詢 RED TOKEN 的價格。
RED TOKEN 的目前價格是多少?
RED TOKEN 的即時價格為 NT$0.01(RED/TWD),目前市值為 NT$37,549,405.83 TWD。由於加密貨幣市場全天候不間斷交易,RED TOKEN 的價格經常波動。您可以在 Bitget 上查看 RED TOKEN 的市場價格及其歷史數據。
RED TOKEN 的 24 小時交易量是多少?
在最近 24 小時內,RED TOKEN 的交易量為 NT$110.34M。
RED TOKEN 的歷史最高價是多少?
RED TOKEN 的歷史最高價是 NT$1.04。這個歷史最高價是 RED TOKEN 自推出以來的最高價。
我可以在 Bitget 上購買 RED TOKEN 嗎?
可以,RED TOKEN 目前在 Bitget 的中心化交易平台上可用。如需更詳細的說明,請查看我們很有幫助的 如何購買 指南。
我可以透過投資 RED TOKEN 獲得穩定的收入嗎?
當然,Bitget 推出了一個 策略交易平台,其提供智能交易策略,可以自動執行您的交易,幫您賺取收益。
我在哪裡能以最低的費用購買 RED TOKEN?
Bitget提供行業領先的交易費用和市場深度,以確保交易者能够從投資中獲利。 您可通過 Bitget 交易所交易。
在哪裡可以購買加密貨幣?
影片部分 - 快速認證、快速交易

如何在 Bitget 完成身分認證以防範詐騙
1. 登入您的 Bitget 帳戶。
2. 如果您是 Bitget 的新用戶,請觀看我們的教學,以了解如何建立帳戶。
3. 將滑鼠移到您的個人頭像上,點擊「未認證」,然後點擊「認證」。
4. 選擇您簽發的國家或地區和證件類型,然後根據指示進行操作。
5. 根據您的偏好,選擇「手機認證」或「電腦認證」。
6. 填寫您的詳細資訊,提交身分證影本,並拍攝一張自拍照。
7. 提交申請後,身分認證就完成了!
加密貨幣投資(包括透過 Bitget 線上購買 RED TOKEN)具有市場風險。Bitget 為您提供購買 RED TOKEN 的簡便方式,並且盡最大努力讓用戶充分了解我們在交易所提供的每種加密貨幣。但是,我們不對您購買 RED TOKEN 可能產生的結果負責。此頁面和其包含的任何資訊均不代表對任何特定加密貨幣的背書認可,任何價格數據均採集自公開互聯網,不被視為來自Bitget的買賣要約。
Bitget 觀點

Samullah
2小時前
lMIRA NETWORK
Referral code-( Samiullah001) With a limited supply of 250 million tokens only, don't regret missing $PI network start mining on MIRA NETWORK app available on play store, and get your first coin for free
using my referral code, Samiullah001
$BTC $DOGE $ETH $XRP $BCH $RED $MUBARAK $PAWS $PAW $TRUMPl
$PI $SUNDOG $BTC $DOGE $BGB $BNB $CEC $LTC $QTUM $INVITE $USDC $ADA $ETH
SUNDOG-1.30%
RED-1.58%

Front Runners_
3小時前
$ETH | Ethereum is still hovering near the lows, and if TradFi opens red (in 30min), things could get spicy.
There’s a cluster of whale liquidation levels around $1,600 to $1,700. If we see sharp wicks down like we did Friday, it’s likely those liquidations are getting
ETH+1.21%
NEAR-3.00%

Crypto-Ticker
3小時前
Bitcoin Price Dips Below Major Averages—Crash or Recovery Ahead?
Bitcoin (BTC) is currently teetering on a crucial edge, with price action signaling potential for either a sharp breakdown or a decisive rebound. As we close out March 2025, the crypto market appears tense—investors are watching the charts closely, looking for confirmation. Let’s dig into what’s unfolding on the Bitcoin price daily chart, interpret the technical indicators, and try to answer the burning question—what’s next for BTC?
From the daily Heikin Ashi candlesticks, it’s evident that Bitcoin has been stuck in a sluggish drift since mid-March. The current price sits at around $81,868, with red candles gaining dominance, indicating selling pressure. The candles lack long upper wicks, a common trait during consolidations or bearish momentum buildups. The price is now trending below all key moving averages, a technical warning that the bulls are losing grip.
The chart is overlaid with a Moving Average Ribbon featuring SMA 20, 50, 100, and 200. Here's the breakdown:
When Bitcoin price trades below the 200-day SMA, it often signals macro-weakness. The compression of the moving averages above the price suggests a possible "death ribbon" effect, where convergence could lead to a continuation of downside unless bulls step in aggressively.
Below the price chart, the Accumulation/Distribution Line (ADL) provides insight into volume flow. The ADL currently reads 1,588.39, and while it's been recovering from January lows, the last few days show flattening and slight down-tilt. This suggests distribution is beginning to outweigh accumulation again—essentially meaning more traders are offloading BTC than buying.
ADL is a volume-based indicator that tracks the flow of money into or out of an asset. A rising ADL signals accumulation, while a falling or flat one signals distribution. BTC’s current ADL action aligns with the price slipping under key SMAs.
Bitcoin's nearest support lies around the $80,000 psychological level, which has previously acted as a springboard in late January. A breakdown below this level could expose BTC to a deeper retracement toward $75,000 or even $72,000, depending on the velocity of the sell-off. Conversely, if BTC finds support here and volume picks up, it might test the 200 SMA again at ~$86,000.
This zone is absolutely crucial. It’s not just a technical level but also a sentiment trigger. A bounce here could reignite bullish interest—while a break might spiral into FUD (fear, uncertainty, and doubt).
For bulls to regain control, they need to push BTC price back above the 20-day and 50-day SMAs , turning them into support. That means a daily close above $88,500 would be an early sign of strength. But more than that, it will take volume confirmation and a visible uptick in the ADL to support any upward momentum.
If that happens, BTC price could re-attempt a rally back toward $93,000+, and reclaiming the 100 SMA could open doors for retesting all-time highs.
Given the current trend, short-term bias is tilted bearish, but the structure still holds above key psychological levels. If BTC price closes multiple daily candles below $80,000, we may see accelerated selling. However, if it holds and bounces with volume confirmation, we could witness an April surprise rally.
Short-Term Bearish Target: $78,000 Neutral Zone: $80,000–$86,000 Bullish Breakout Target: $93,000+
Bitcoin price is approaching a pivotal moment . With daily candles closing below major moving averages and volume trends cooling off, cautious sentiment is warranted. Yet crypto often thrives in uncertainty—and a sudden reversal is always on the table. For now, traders should monitor the $80K level like a hawk and prepare for volatility in either direction as April begins.
BTC+0.44%
UP-2.80%

CrYpTo_KiNg0080
3小時前
🚨 Whale Re-enters the TRUMP Market After Major Losses – Can He Turn It Around? 💸
A high-profile *whale* has made waves in the market again, re-entering the *TRUMP* trade after a series of *mixed outcomes*. Let's dive into the details of his trading history and recent moves! 📉📈
Whale's Trading Journey with TRUMP 🔍
- *FirstTRUMP Trade*:
- *Profit Realized*: *11.82 Million* ✅
- This was the whale’s *only profitable trade*, signaling that his first entry was on point, locking in solid gains. 🏆
- *SecondTRUMP Trade*:
- *Loss Incurred*: *24.35 Million* ❌
- A *major downturn* followed, leading to *significant losses* on the second trade. This could have been a tough blow for the whale, especially given the size of the loss. 💔
- *ThirdTRUMP Trade*:
- *Loss Incurred*: *201,000* ❌
- While *smaller in scale*, this trade also ended in the red. A series of smaller losses but still a sign that the whale wasn't able to catch the next market bounce. 🧩
- *FourthTRUMP Trade (Sold 5 hours ago)*:
- *Loss Incurred*: *3.3 Million* ❌
- The whale sold *743,947TRUMP* for *7.92 Million* at an average price of *10.66*. The result? A *3.3M loss*. This trade marks the *fourth consecutive loss* for the whale in theTRUMP market. 📉
- *Total Realized Loss*: *$15.7 Million* 💔
- After all these trades, the *whale has realized a total loss of15.7M* from the TRUMP position, marking a rough stretch of bad trades. 😣
*New Position – Fifth Major Trade* 💡
- *Capital Deployed*: *2,907,704* 💰
- The whale has committed *nearly 3M* to the *TRUMP* market again, signaling that despite past losses, there’s *confidence* in the potential for a rebound.
- *Tokens Acquired*: *284,690 TRUMP* 🪙
- With this new position, the whale now holds *284,690TRUMP tokens*, likely hoping that *this entry point* will bring a profitable return.
- *Average Entry Price*: *10.2136* 💵
- The average price paid for this new batch ofTRUMP is *10.21*, slightly lower than the previous trade price of *10.66*. This suggests that the whale is *trying to catch a better entry* as the price of TRUMP fluctuates. 🎯
*Will This Position Yield a Recovery? 🔮*
*Predictions and Analysis*:
- *Short-term*: Given the *previous losses*, there’s *a lot of skepticism* around whether this new position will turn profitable. The market can be volatile, and with the whale’s history of losses, it’s unclear if the *price ofTRUMP* will recover quickly. 📉
- *Mid-term*: If the whale’s entry at *10.21* is near the *bottom*, then there could be a chance of a *rebound* in the coming weeks. A *positive news event* or market shift could potentially driveTRUMP's price up, helping the whale recover some of his losses. 🚀
- *Long-term*: For a true *recovery* and to make back the 15.7M in losses, *TRUMP* would need to see a *major bull run* or substantial positive momentum. Without a strong market catalyst, the whale’s position might face further drawdowns. 📉
*Key Takeaways 💡*
- The *whale is taking a calculated risk*, betting on a recovery in TRUMP after several painful losses.
- The new entry point suggests he believes that *TRUMP* has reached a *local bottom*, but *short-term volatility* remains a major factor.
- Traders should *monitor closely* if *TRUMP* consolidates above the *10* mark for any signs of bullish reversal. If the whale’s entry proves successful, it could be the start of a *strong recovery*. 📊
What do you think? Will this whale get back in the green, or will $TRUMP’s price continue to slide? Drop your thoughts below! ⬇️💬
$TRUMP
RED-1.58%
MAJOR+3.72%

moslim🪁
3小時前
XRP Price Prediction: Can XRP Hit $5 If It Breaks Key Resistance, Like JetBolt Reaches
The crypto market is currently mostly in the red, casting a shadow over the latest XRP price prediction. Even with generally upbeat news about the upcoming resolution of Ripple’s lawsuit with the SEC, XRP has fallen 14.3% over the past week.
As uncertainty hangs over the crypto landscape, analysts and market watchers are now asking: Can XRP Hit $5 If It Can Break Key Resistance Levels?
Amid the XRP price predictions, talk of the up-and-coming altcoin JetBolt (JBOLT) is intensifying. Crypto experts are bullish on the latest JetBolt presale milestone, with token sales topping $3.2 million. As JetBolt reaches incredible heights, crypto insiders are wondering what is driving this altcoin that is so attractive in pre-sales.
This in-depth report will look at the stories shaping the latest XRP price predictions and the dynamics behind JetBolt’s meteoric rise.
$XRP
RED-1.58%
XRP-1.77%
相關資產