Bitget: Ranked top 4 in global daily trading volume!
BTC market share61.15%
New listings on Bitget: Pi Network
BTC/USDT$82548.90 (-1.82%)Fear and Greed Index26(Fear)
Altcoin season index:0(Bitcoin season)
Coins listed in Pre-MarketPAWS,WCTTotal spot Bitcoin ETF netflow -$93.2M (1D); +$445.2M (7D).Welcome gift package for new users worth 6200 USDT.Claim now
Trade anytime, anywhere with the Bitget app. Download now

Coin-related
Price calculator
Price history
Price prediction
Technical analysis
Coin buying guide
Crypto category
Profit calculator


FUD priceFUD
Listed
Quote currency:
USD
$0.{7}4135-6.98%1D
Price chart
TradingView
Last updated as of 2025-03-29 15:05:02(UTC+0)
Market cap:--
Fully diluted market cap:--
Volume (24h):$225,318.01
24h volume / market cap:0.00%
24h high:$0.{7}4495
24h low:$0.{7}4128
All-time high:$0.{6}9356
All-time low:$0.{7}4096
Circulating supply:-- FUD
Total supply:
75,490,000,000,000FUD
Circulation rate:0.00%
Max supply:
--FUD
Price in BTC:0.{12}5013 BTC
Price in ETH:0.{10}2239 ETH
Price at BTC market cap:
--
Price at ETH market cap:
--
Contracts:--
How do you feel about FUD today?
Note: This information is for reference only.
Price of FUD today
The live price of FUD is $0.{7}4135 per (FUD / USD) today with a current market cap of $0.00 USD. The 24-hour trading volume is $225,318.01 USD. FUD to USD price is updated in real time. FUD is -6.98% in the last 24 hours. It has a circulating supply of 0 .
What is the highest price of FUD?
FUD has an all-time high (ATH) of $0.{6}9356, recorded on 2024-10-03.
What is the lowest price of FUD?
FUD has an all-time low (ATL) of $0.{7}4096, recorded on 2025-03-29.
FUD price prediction
When is a good time to buy FUD? Should I buy or sell FUD now?
When deciding whether to buy or sell FUD, you must first consider your own trading strategy. The trading activity of long-term traders and short-term traders will also be different. The Bitget FUD technical analysis can provide you with a reference for trading.
According to the FUD 4h technical analysis, the trading signal is Strong sell.
According to the FUD 1d technical analysis, the trading signal is Sell.
According to the FUD 1w technical analysis, the trading signal is Strong sell.
What will the price of FUD be in 2026?
Based on FUD's historical price performance prediction model, the price of FUD is projected to reach $0.{7}5688 in 2026.
What will the price of FUD be in 2031?
In 2031, the FUD price is expected to change by +46.00%. By the end of 2031, the FUD price is projected to reach $0.{7}9717, with a cumulative ROI of +119.91%.
FUD price history (USD)
The price of FUD is -93.25% over the last year. The highest price of FUD in USD in the last year was $0.{6}9356 and the lowest price of FUD in USD in the last year was $0.{7}4096.
TimePrice change (%) Lowest priceHighest price
Lowest priceHighest price 24h-6.98%$0.{7}4128$0.{7}4495
7d-31.91%$0.{7}4128$0.{7}6015
30d-44.08%$0.{7}4096$0.{6}1082
90d-80.39%$0.{7}4096$0.{6}2968
1y-93.25%$0.{7}4096$0.{6}9356
All-time-83.79%$0.{7}4096(2025-03-29, Today )$0.{6}9356(2024-10-03, 177 days ago )
FUD market information
FUD market
FUD holdings by concentration
Whales
Investors
Retail
FUD addresses by time held
Holders
Cruisers
Traders
Live coinInfo.name (12) price chart

FUD ratings
Average ratings from the community
4.6
This content is for informational purposes only.
About FUD (FUD)
What Is FUD?
FUD is a meme coin on the Sui blockchain. It is designed to reward early Sui NFT communities and builders, embodying a fun and playful spirit with its branding centered around a pug. FUD aims to raise awareness of the unique technological opportunities offered by the Sui network, providing a lighthearted yet impactful way to engage users and promote blockchain innovation. The project was launched in May 2024.
Resources
Official Website:
https://fudthepug.com/
How Does FUD Work?
FUD operates on the Sui blockchain, leveraging its advanced capabilities to support a vibrant ecosystem of decentralized finance (DeFi) platforms and games. This meme coin is integrated with several DeFi applications, including Turbos, Cetus, Aftermath, and Typus, allowing users to participate in various financial activities such as lending, borrowing, and trading. Additionally, FUD is featured in multiple games like WinX, Buck You CNY, Suilette, and Moonshot, providing entertainment while promoting
cryptocurrency adoption and utility.
What Is FUD Token?
FUD is the native token of the FUD platform. The meme coin's distribution model is designed to foster community growth and long-term development. FUD has a total supply of 100 trillion tokens.
What Determines FUD’s Price?
FUD's price is primarily determined by supply and demand within the blockchain and web3 ecosystems. Key factors include the latest news and cryptocurrency trends, which influence market interest in FUD's integrations with DeFi platforms and games. Positive cryptocurrency price predictions can boost its value, positioning it as a potential best crypto investment for 2024 and beyond. However, investors should also consider cryptocurrency risks and the impact of social media buzz on this meme coin's price dynamics.
For those interested in investing or trading FUD, one might wonder: Where to buy FUD? You can purchase FUD on leading exchanges, such as Bitget, which offers a secure and user-friendly platform for cryptocurrency enthusiasts.
FUD to local currency
1 FUD to MXN$01 FUD to GTQQ01 FUD to CLP$01 FUD to HNLL01 FUD to UGXSh01 FUD to ZARR01 FUD to TNDد.ت01 FUD to IQDع.د01 FUD to TWDNT$01 FUD to RSDдин.01 FUD to DOP$01 FUD to MYRRM01 FUD to GEL₾01 FUD to UYU$01 FUD to MADد.م.01 FUD to OMRر.ع.01 FUD to AZN₼01 FUD to SEKkr01 FUD to KESSh01 FUD to UAH₴0
- 1
- 2
- 3
- 4
- 5
Last updated as of 2025-03-29 15:05:02(UTC+0)
How to buy FUD(FUD)

Create Your Free Bitget Account
Sign up on Bitget with your email address/mobile phone number and create a strong password to secure your account.

Verify Your Account
Verify your identity by entering your personal information and uploading a valid photo ID.

Convert FUD to FUD
Use a variety of payment options to buy FUD on Bitget. We'll show you how.
Learn MoreJoin FUD copy trading by following elite traders.
After signing up on Bitget and successfully buying USDT or FUD tokens, you can also start copy trading by following elite traders.
FUD news

Should’ve Gone to Eton Kid: UK Financial Regulator Takes Aim at Young British Traders
99bitcoins•2025-03-28 04:55

Bitcoin futures 'deleveraging' wipes $10B open interest in 2 weeks
Cointelegraph•2025-03-19 07:29
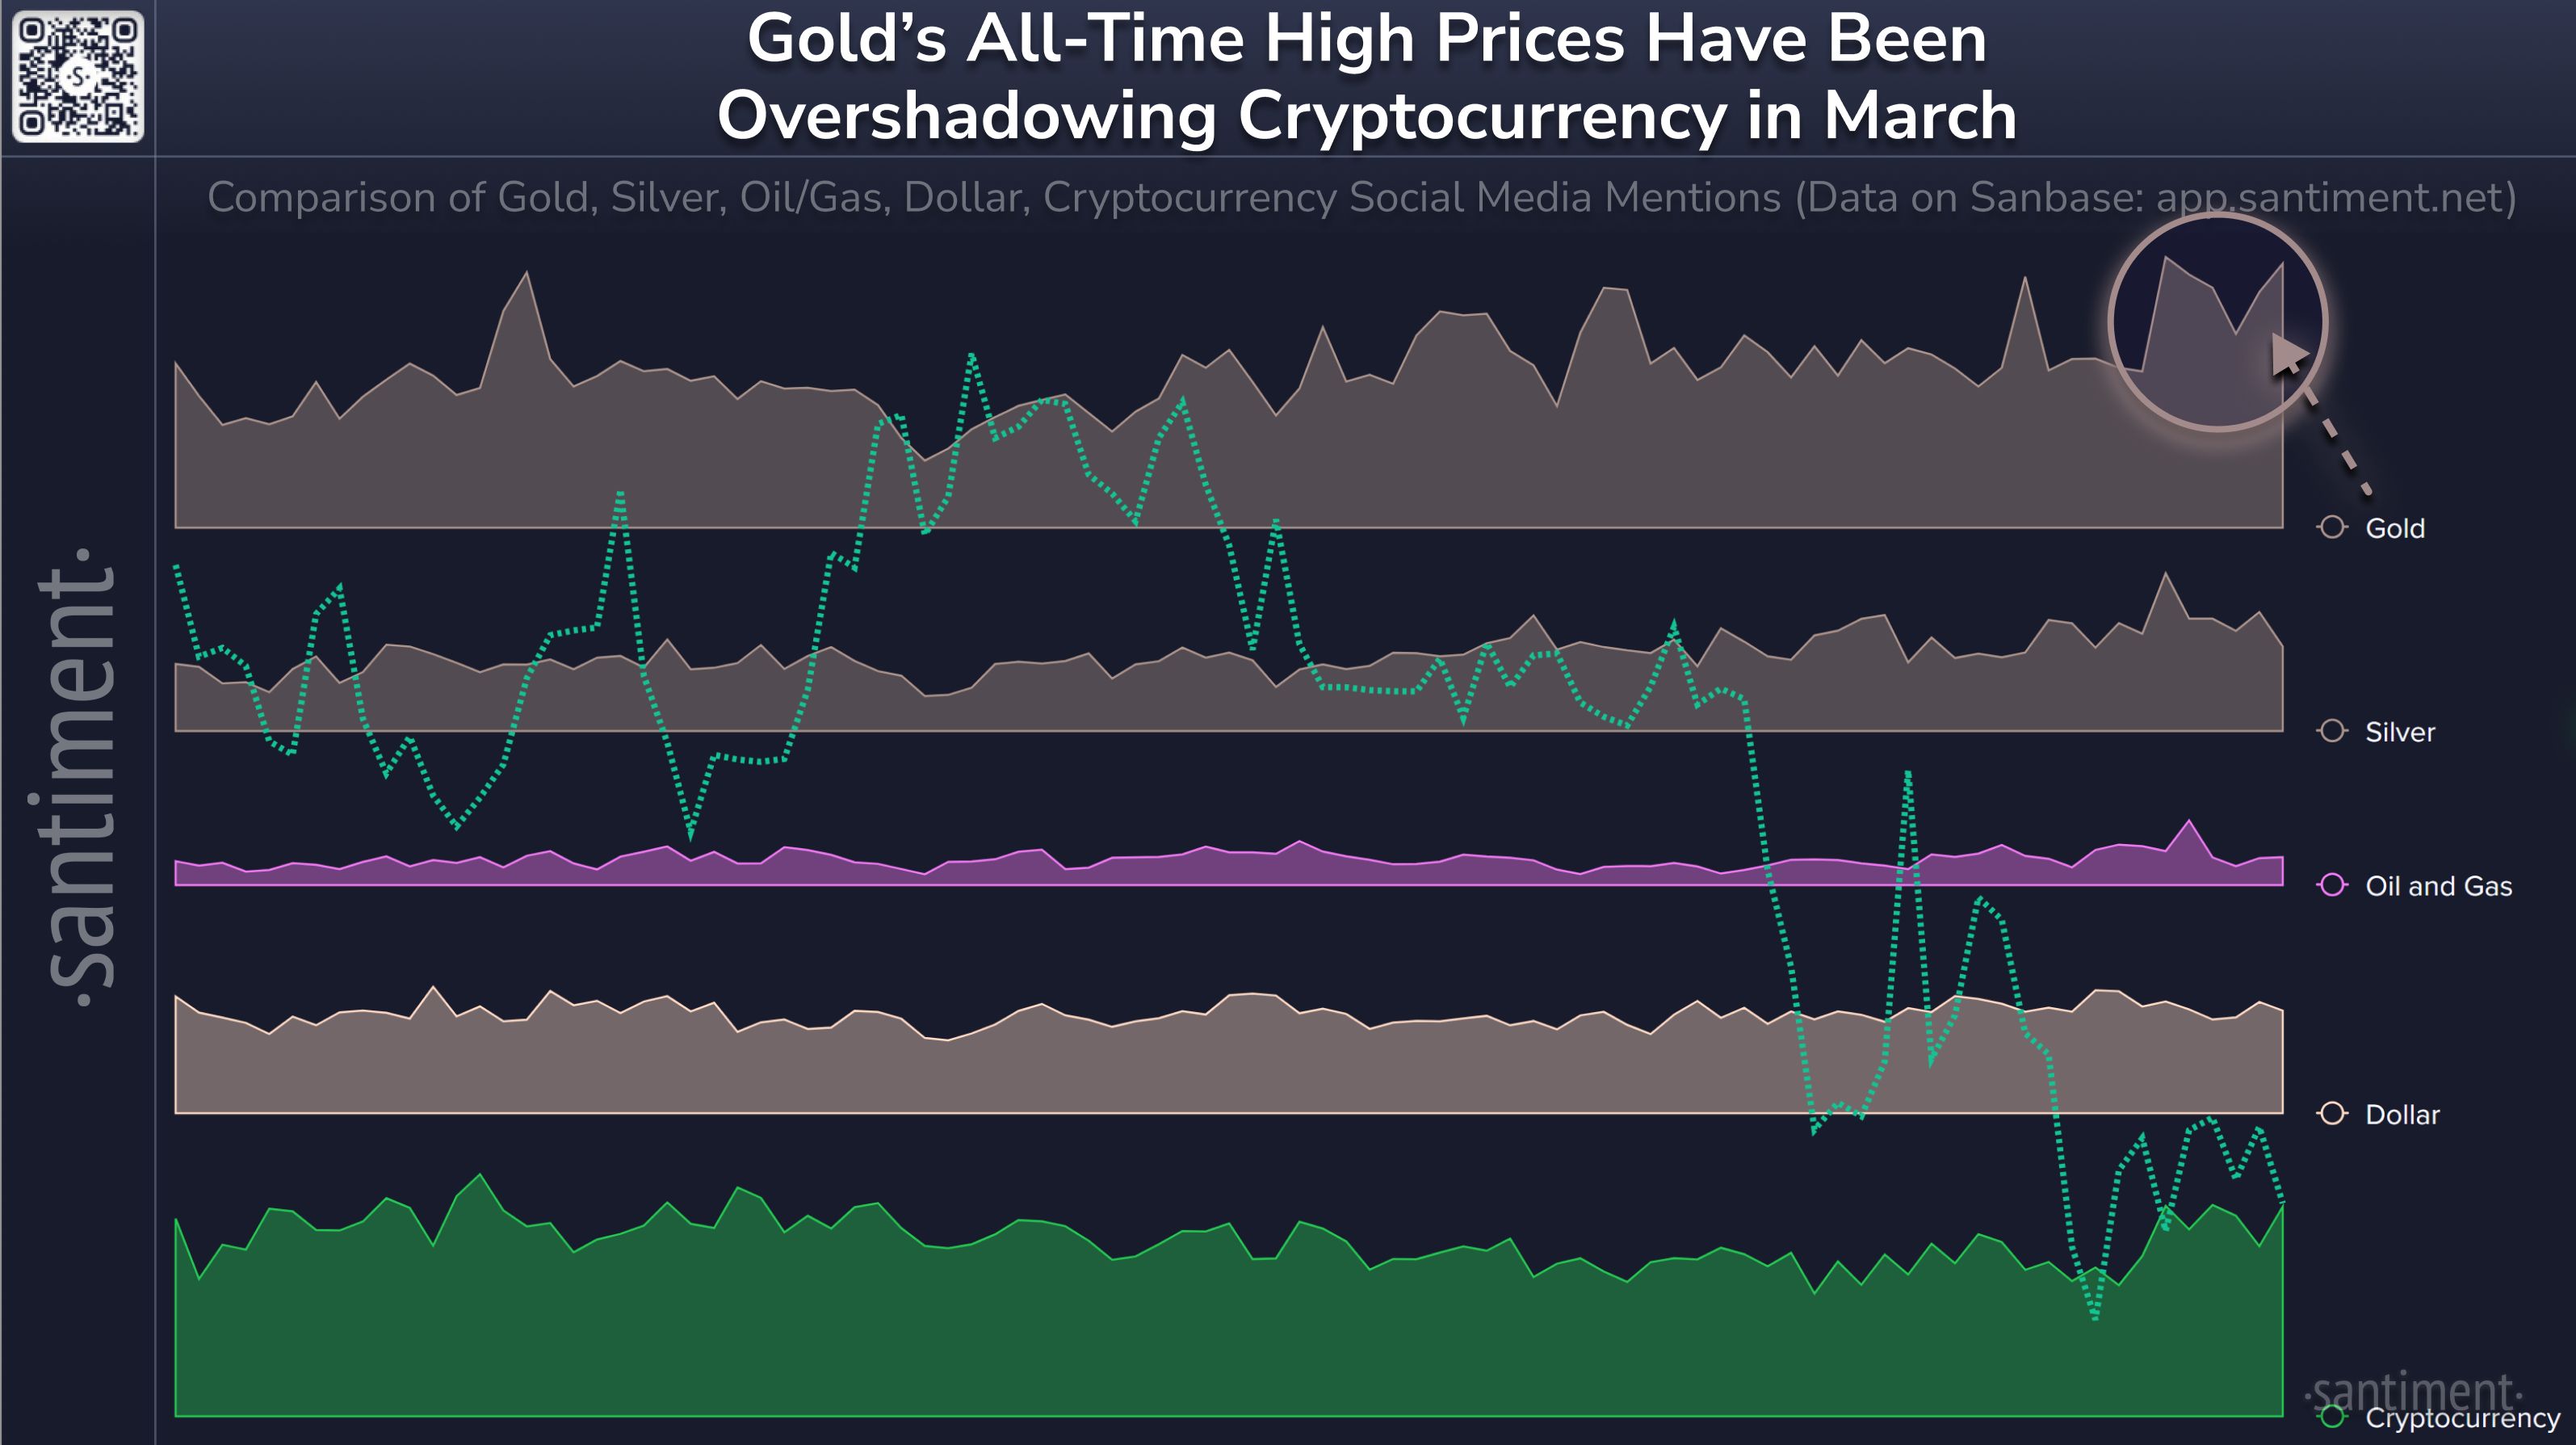
'Digital Gold' No Match For Real Gold?
Santiment•2025-03-19 00:44
Michael Saylor’s Strategy outperforms Bitcoin. Is a reversal coming?
Share link:In this post: Strategy’s stock is outperforming Bitcoin amid Bitcoin’s price struggles, with a 358.5% return in 2024—three times Bitcoin’s gains. Michael Saylor’s company holds 499,096 BTC, worth $42 billion, but its market cap is $77.4 billion, showing a massive premium. Leverage is fueling the gains, but if Bitcoin drops, Strategy’s stock could crash harder due to its debt-heavy balance sheet.
Cryptopolitan•2025-03-18 10:33
Hyperliquid Trader’s 40x BTC Short Nears $3.7M Floating Loss as Bitcoin Tests Key Levels
Bitcoin.com•2025-03-18 08:22

Buy more


FAQ
What is the current price of FUD?
The live price of FUD is $0 per (FUD/USD) with a current market cap of $0 USD. FUD's value undergoes frequent fluctuations due to the continuous 24/7 activity in the crypto market. FUD's current price in real-time and its historical data is available on Bitget.
What is the 24 hour trading volume of FUD?
Over the last 24 hours, the trading volume of FUD is $225,318.01.
What is the all-time high of FUD?
The all-time high of FUD is $0.{6}9356. This all-time high is highest price for FUD since it was launched.
Can I buy FUD on Bitget?
Yes, FUD is currently available on Bitget’s centralized exchange. For more detailed instructions, check out our helpful How to buy fud guide.
Can I get a steady income from investing in FUD?
Of course, Bitget provides a strategic trading platform, with intelligent trading bots to automate your trades and earn profits.
Where can I buy FUD with the lowest fee?
Bitget offers industry-leading trading fees and depth to ensure profitable investments for traders. You can trade on the Bitget exchange.
Where can I buy FUD (FUD)?
Video section — quick verification, quick trading

How to complete identity verification on Bitget and protect yourself from fraud
1. Log in to your Bitget account.
2. If you're new to Bitget, watch our tutorial on how to create an account.
3. Hover over your profile icon, click on “Unverified”, and hit “Verify”.
4. Choose your issuing country or region and ID type, and follow the instructions.
5. Select “Mobile Verification” or “PC” based on your preference.
6. Enter your details, submit a copy of your ID, and take a selfie.
7. Submit your application, and voila, you've completed identity verification!
Cryptocurrency investments, including buying FUD online via Bitget, are subject to market risk. Bitget provides easy and convenient ways for you to buy FUD, and we try our best to fully inform our users about each cryptocurrency we offer on the exchange. However, we are not responsible for the results that may arise from your FUD purchase. This page and any information included are not an endorsement of any particular cryptocurrency. Any price and other information on this page is collected from the public internet and can not be consider as an offer from Bitget.
Bitget Insights

muphy
6h
$PARTI: Bearish Warning or Buy-the-Dip Opportunity?
Introduction: Market Sentiment Shift – Should Investors Be Worried?
$PARTI has recently attracted attention in the crypto market, but like any asset, its price action is subject to fluctuations. While some traders remain bullish, others are starting to express concerns about a potential bearish phase.
The key question is: Are we witnessing a genuine bearish warning for $PARTI, or is this just a temporary correction that presents a “buy-the-dip” opportunity? To answer this, we need to analyze market indicators, investor sentiment, key support levels, and external market factors.
1. Bearish Warning Signals: Is $PARTI at Risk?
A bearish trend can emerge for multiple reasons—ranging from declining trading volume to external macroeconomic conditions. Here are some major warning signs that investors should monitor:
Technical Indicators Showing Weakness
Declining Trading Volume: A decrease in volume while price drops could indicate weakening demand and fading bullish momentum.
Bearish Chart Patterns: Patterns like head and shoulders, double tops, or a descending triangle may signal an upcoming downtrend.
RSI and MACD Indicators: If the Relative Strength Index (RSI) drops below 40 or the MACD shows a bearish crossover, this could indicate increasing selling pressure.
Investor Sentiment & Market Behavior
Increased Whale Sell-offs: If on-chain data shows large holders selling, it might suggest a loss of confidence in the project.
Fear in the Market: If the broader crypto market is experiencing FUD (fear, uncertainty, and doubt), smaller tokens like $PARTI may be more vulnerable to corrections.
Break of Key Support Levels: If $PARTI falls below major support zones, it could trigger a cascade of stop-loss triggers and panic selling.
If these bearish signals continue to strengthen, $PARTI could enter an extended downtrend, leading to a longer cooling-off phase before another potential rally.
2. Is This a Buy-the-Dip Opportunity?
Not all price corrections indicate the beginning of a long-term bearish trend. Sometimes, market pullbacks create a perfect opportunity for smart investors to accumulate tokens at a discount before the next leg up. Here’s how to determine if $PARTI’s dip is worth buying:
Key Signs That Support a Buy-the-Dip Strategy
Strong Fundamental Development: If $PARTI’s roadmap remains intact and partnerships continue growing, a price dip could just be temporary market noise rather than a sign of long-term decline.
Holding Above Key Support Levels: If $PARTI finds strong buying interest at major support zones (e.g., 50-day or 200-day moving averages), this could indicate that institutional investors or whales are accumulating.
Oversold RSI (Below 30): If the RSI indicator shows extreme overselling, it may signal a potential reversal and recovery.
Market-Wide Recovery Signals: If Bitcoin and the overall crypto market start rebounding, smaller altcoins like $PARTI could follow suit.
Important Reminder:
Before buying the dip, always confirm whether the price correction is organic or due to fundamental weaknesses. If negative news is causing the drop (e.g., project delays, security issues, or loss of key partners), it might not be wise to buy immediately.
3. External Market Factors: Are Broader Conditions Favorable?
Regardless of $PARTI’s individual performance, it’s crucial to assess the wider crypto market and global financial conditions. Here’s why:
Bitcoin’s Trend: Altcoins often follow Bitcoin’s direction. If BTC remains bullish, $PARTI may recover. If BTC crashes, $PARTI could struggle to sustain momentum.
Regulatory News: Negative regulations can trigger bearish movements across the entire crypto space.
Macroeconomic Factors: Rising interest rates, stock market instability, or global economic slowdowns can reduce investor appetite for riskier assets like altcoins.
If overall market conditions are bullish, then $PARTI’s dip is more likely a healthy retracement rather than the start of a prolonged downtrend.
4. Final Verdict: Bearish or Buy-the-Dip?
If technical indicators show weakening momentum, whale sell-offs increase, and major support levels break, a bearish trend may develop.
If $PARTI is holding above key support zones, remains fundamentally strong, and on-chain data shows accumulation, it could be a prime buy-the-dip opportunity.
Broader market trends (Bitcoin, regulatory news, and economic conditions) will also play a key role in determining $PARTI’s next move.
Recommended Strategy:
✅ Short-Term Traders: Watch for a potential breakdown of support before making decisions. If key levels break, it might be wise to wait before re-entering.
✅ Long-Term Investors: If fundamentals remain strong, consider laddering buys (DCA strategy) rather than going all in at once.
Conclusion:
While there are some bearish warning signs, $PARTI could still present a lucrative buy-the-dip opportunity if it holds above crucial support levels. Investors should remain cautious, track market trends closely, and avoid emotional trading.
$PARTI
BTC-2.22%
MOVE-7.50%
muphy
7h
Trading Experience and Strategic Considerations for $BANANAS31
Trading $BANANAS31 , like any cryptocurrency, requires an understanding of market dynamics, liquidity conditions, price volatility, and strategic execution. Given its recent listing on Bitget, traders now have access to spot and futures trading, creating multiple trading opportunities. Below is a deep dive into key aspects of trading this token effectively.
1. Understanding Market Behavior and Trading Experience
a) Volatility and Liquidity Considerations
Since newly listed tokens often experience high volatility, $BANANAS31COIN is expected to display significant price swings in its early trading phases.
High volatility can be beneficial for traders who capitalize on price movements through short-term trades or futures contracts.
Liquidity levels on Bitget will play a role in how easily traders can enter or exit positions. Higher liquidity leads to smoother trades, while low liquidity can result in higher slippage and price manipulation risks.
Strategic Tip: Monitor trading volume and order book depth before placing trades. Avoid large market orders in low-liquidity conditions to prevent unnecessary slippage.
b) Futures Trading and Leverage Opportunities
Bitget’s BANANAS31USDT-M perpetual futures allow traders to go long (buy) or short (sell) with leverage of up to 25x.
Long Position Strategy: Traders expecting price appreciation can enter a long position and benefit from price increases.
Short Position Strategy: If market sentiment turns bearish, traders can use short positions to profit from price declines.
Leverage Trading Risks:
Higher leverage amplifies gains but also increases the risk of liquidation if the market moves against the trade.
Using stop-loss orders is critical to avoid losing the entire margin.
Strategic Tip: Beginners should start with low leverage (2x-5x) before gradually increasing exposure. Always use a risk-to-reward ratio of at least 1:2 to ensure profitable trades.
2. Technical Analysis for Trading $BANANAS31COIN
a) Key Support and Resistance Levels
Support levels are price zones where buyers step in, preventing further declines.
Resistance levels are price ceilings where selling pressure increases.
For example:
If $BANANAS31COIN breaks above a strong resistance level, it may signal a bullish breakout.
If it fails to break resistance, traders might expect a pullback to a support level.
Strategic Tip: Use trendlines and Fibonacci retracements to identify key support and resistance levels for better trade execution.
b) Moving Averages and Momentum Indicators
Traders often use moving averages (MAs) to determine the overall trend.
50-day MA crossing above the 200-day MA = Bullish signal (Golden Cross).
50-day MA crossing below the 200-day MA = Bearish signal (Death Cross).
Other useful indicators:
Relative Strength Index (RSI): If RSI is above 70, the token is overbought (possible correction). If below 30, it’s oversold (possible bounce).
MACD Indicator: A bullish MACD crossover signals upward momentum, while a bearish crossover suggests a decline.
Strategic Tip: Combine multiple indicators (e.g., RSI + MACD) to confirm trends before entering trades.
3. Risk Management and Trade Execution Strategies
a) Position Sizing and Stop-Loss Placement
Risk management is crucial, especially when trading volatile assets like $BANANAS31COIN.
Never risk more than 1-2% of your trading capital per trade.
Use stop-loss orders at key technical levels to limit losses.
Adjust take-profit levels based on a 1:2 or 1:3 risk-reward ratio.
Example: If entering at $0.0025, with a stop-loss at $0.0020, your take-profit should be at least $0.0030 to maintain a favorable risk-reward ratio.
b) Scalping, Swing Trading, and Holding Strategies
1. Scalping (Short-Term Trading)
Involves making multiple small trades within a few minutes or hours.
Best suited for high-liquidity conditions where bid-ask spreads are narrow.
Requires using 5-minute or 15-minute charts for quick execution.
Tip: Use trailing stop-loss orders to protect profits as price moves favorably.
2. Swing Trading (Medium-Term Trading)
Holding positions for days to weeks to profit from market swings.
Uses daily or 4-hour charts for analysis.
Trades are often based on trend reversals and breakouts.
Tip: Look for bullish engulfing patterns or MACD crossovers before entering swing trades.
3. HODLing (Long-Term Holding)
Involves buying and holding $BANANAS31COIN for months or years, expecting price appreciation.
Requires belief in strong fundamentals, roadmap developments, and adoption.
Tip: Dollar-cost averaging (DCA) is a great way to build a position gradually, reducing the impact of short-term volatility.
4. Sentiment Analysis and Market Trends
a) Social Media Influence and Community Hype
Meme coins and community-driven projects often rely on strong social media engagement.
Positive sentiment (trending on Twitter, Telegram, or Reddit) can lead to price rallies.
Negative sentiment (scams, FUD, rug-pull rumors) can trigger mass sell-offs.
Strategic Tip: Monitor social listening tools and sentiment indicators on platforms like LunarCrush, Santiment, and Twitter analytics.
b) Institutional and Whale Activity
If whales are accumulating, it could signal long-term confidence in the token.
If large sell-offs occur, it may indicate an upcoming price drop.
Strategic Tip: Use on-chain data tools like Whale Alert, Glassnode, or Nansen to track large wallet transactions.
5. Final Thoughts: Key Takeaways for Traders
Short-Term Traders:
✅ Focus on scalping and swing trading for quick profits.
✅ Use technical indicators (RSI, MACD, Moving Averages) to time entries/exits.
✅ Trade with low leverage initially and manage risk with stop-losses.
Long-Term Investors:
✅ Evaluate fundamental factors before committing to large positions.
✅ Use DCA (Dollar-Cost Averaging) to accumulate tokens gradually.
✅ Stay updated on project developments, partnerships, and roadmap progress.
General Trading Best Practices:
✅ Always have a trading plan before entering a position.
✅ Avoid emotional trading (fear and greed often lead to poor decisions).
✅ Stay updated with news, exchange listings, and macro market trends.
Final Verdict:
$BANANAS31COIN is a high-risk, high-reward asset, making it an exciting choice for active traders and speculative investors. Proper risk management, market analysis, and strategic execution will determine whether traders succeed or face significant losses.
X+1.84%
FUD-6.34%
muphy
20h
$IMTCOIN Price Prediction: Will It Skyrocket or Struggle?
With $IMTCOIN now listed on Bitget, traders and investors are closely watching its price movement to determine if it will skyrocket or struggle in the coming days and weeks. Price prediction in crypto depends on multiple factors, including market sentiment, technical analysis, trading volume, macroeconomic influences, and project fundamentals. Let’s analyze these aspects deeply.
1️⃣ Market Sentiment & Investor Demand: A Strong or Weak Start?
One of the strongest drivers of a coin’s price is investor sentiment. If traders believe in $IMTCOIN’s potential, they will accumulate more, leading to a sustained price increase.
Bullish Sentiment (Skyrocket Factors)
✅ Positive Social Media & Community Engagement – If $IMTCOIN is trending on Twitter, Telegram, and Bitget Insights, this can lead to higher FOMO (Fear of Missing Out) and drive prices higher.
✅ Strong Initial Trading Volume – A high 24-hour trading volume indicates strong demand, meaning more buyers are entering the market than sellers.
✅ Whale Accumulation – If large holders (whales) are accumulating, it suggests confidence in the coin’s long-term potential.
Bearish Sentiment (Struggle Factors)
❌ Profit-Taking from Early Buyers – If too many traders sell quickly after launch, it could create short-term downward pressure.
❌ Low Trading Interest – If volume dries up, liquidity might become an issue, leading to a weak market structure.
❌ FUD (Fear, Uncertainty, Doubt) – Negative rumors or lack of trust in the project can impact price performance.
🔎 Key Question: Is market hype strong enough to push $IMTCOIN’s price higher, or is there a risk of short-term sell-offs?
2️⃣ Technical Analysis: Bullish or Bearish Chart Signals?
Technical indicators can provide insights into whether $IMTCOIN is forming an uptrend or facing resistance.
Bullish Indicators (Skyrocketing Scenario)
✅ Higher Highs & Higher Lows – If price action is forming a clear uptrend, this signals bullish continuation.
✅ Moving Averages Crossover – If the short-term 50-day moving average crosses above the 200-day moving average, it’s a bullish sign (Golden Cross).
✅ RSI Below Overbought Levels – If the Relative Strength Index (RSI) is between 50-70, there’s room for more upward movement.
Bearish Indicators (Struggling Scenario)
❌ Failure to Hold Key Support Levels – If $IMTCOIN breaks below strong support zones, it could trigger more selling.
❌ Low Volume on Breakouts – If price is rising without strong volume, it suggests a weak rally that could reverse.
❌ Bearish Divergence in RSI & MACD – If price is increasing while RSI/MACD is declining, it signals potential weakness.
🔎 Key Question: Is $IMTCOIN showing strong buy pressure, or are bears preparing for a correction?
3️⃣ Trading Volume & Liquidity: Can $IMTCOIN Sustain Momentum?
A coin’s ability to sustain price increases depends heavily on trading volume and liquidity.
If volume remains high, it means the price movement is backed by real demand.
If volume declines, price action may become weak, leading to more volatile swings.
Liquidity depth ensures that large buy/sell orders don’t create extreme price fluctuations.
🔎 Key Question: Is $IMTCOIN attracting sustained trading volume, or is interest fading?
4️⃣ External Factors: What Could Influence $IMTCOIN’s Price?
Beyond technicals, fundamental and external market conditions will play a major role in determining whether $IMTCOIN will skyrocket or struggle.
Bullish Catalysts (Potential for a Big Rally 🚀)
✅ New Exchange Listings – If $IMTCOIN secures additional exchange listings, it will increase accessibility and demand.
✅ Partnership Announcements – Strategic partnerships with major crypto players or institutions could boost investor confidence.
✅ Broader Crypto Market Bull Run – If Bitcoin (BTC) and Ethereum (ETH) continue to rally, altcoins like $IMTCOIN will likely benefit.
Bearish Catalysts (Potential Downside Risks 📉)
❌ Regulatory Uncertainty – If new crypto regulations emerge, it could slow down adoption.
❌ BTC Market Correction – If Bitcoin experiences a major correction, altcoins often follow.
❌ Lack of Adoption or Use Cases – If $IMTCOIN fails to gain real-world adoption, demand may decrease over time.
🔎 Key Question: Are there enough upcoming catalysts to push $IMTCOIN higher, or does it face external risks?
5️⃣ Potential Scenarios for $IMTCOIN’s Price Movement
Scenario 1: Bullish Breakout & Price Surge 🚀
✅ Strong buy pressure pushes price past resistance.
✅ RSI and MACD confirm an uptrend with high volume.
✅ More investors enter, leading to FOMO-driven price growth.
Scenario 2: Short-Term Correction Before Another Rally 🔄
✅ $IMTCOIN faces temporary selling but holds key support.
✅ Smart money accumulates, preparing for a bigger move.
✅ Consolidation phase leads to a future bullish breakout.
Scenario 3: Extended Bearish Trend ❌
❌ Weak trading volume leads to downward pressure.
❌ Market loses interest, and price struggles to regain momentum.
❌ $IMTCOIN breaks below strong support, triggering further selling.
🆑Conclusion: Will $IMTCOIN Skyrocket or Struggle?
The answer depends on:
✅ Market sentiment – Is demand strong enough to drive sustained buying?
✅ Technical trends – Are price patterns showing bullish continuation or bearish exhaustion?
✅ External catalysts – Will exchange listings, partnerships, or broader market trends push $IMTCOIN higher?
📢 Final Thought: If $IMTCOIN maintains strong volume, positive sentiment, and key support levels, it has the potential to skyrocket. However, if liquidity dries up or early investors start selling heavily, it may struggle in the short term.
🚀 Are you bullish or bearish on $IMTCOIN? Drop your predictions below!
$IMT
BTC-2.22%
MOVE-7.50%

Debby001#
1d
$BANANAS31 : Riding the Wild Waves of Meme Coin Volatility
The $BANANAS31 token, intrinsically linked to the "Banana For Scale" project, exists within the notoriously volatile realm of meme coins. Understanding its market volatility is crucial for any potential investor.
The Rollercoaster Ride: $BANANAS31's Volatility Explained
Meme coins are known for their dramatic price swings, and $BANANAS31 is no exception. This volatility stems from a unique combination of factors:
* Community-Driven Hype:
* $BANANAS31's price is heavily influenced by social media trends, viral campaigns, and community sentiment. Rapid shifts in online discussions can trigger equally rapid price changes.
* Meme coins often experience sudden surges in popularity, followed by equally sharp declines.
* Speculative Trading:
* Meme coins attract a high degree of speculative trading. Traders often seek quick profits, leading to increased trading volume and price volatility.
* The lack of fundamental value in some meme coins exacerbates this speculative nature.
* Low Liquidity:
* Depending on the exchange, $BANANAS31 may experience periods of low liquidity, meaning there are fewer buyers and sellers. This can amplify price swings, as even small trades can have a significant impact.
* Market Sentiment:
* The overall sentiment surrounding the cryptocurrency market, and especially the meme coin sector, plays a significant role.
* Fear, uncertainty, and doubt (FUD) can quickly spread through online communities, leading to panic selling and price drops.
* Rapid Trend Shifts:
* Meme coin trends change very rapidly. What is popular one day, may be forgotten the next. This rapid change makes holding meme coins very risky.
Observations and Considerations:
* $BANANAS31's volatility is a defining characteristic and a significant risk factor.
* Investors should be prepared for substantial price swings and potential losses.
* Thorough research and risk management are essential.
* It is very important to monitor social media trends, and community discussions, to gain an understanding of the coins current activity.
FUD-6.34%
BANANAS31+1.26%

Insomniac
1d
No cycle is ever complete without some Tether fud
FUD-6.34%
Related assets
Popular cryptocurrencies
A selection of the top 8 cryptocurrencies by market cap.


Recently added
The most recently added cryptocurrencies.


Comparable market cap
Among all Bitget assets, these 8 are the closest to FUD in market cap.


