Is SUI Following SOL’s Legendary 2021 Path – Historical Fractal Comparison Shows Massive Upside

Date: Fri, April 30, 2025 | 06:10 AM GMT
Over the past three weeks, the crypto market has begun to regain momentum. Ethereum (ETH) alone has rallied 31%, breathing life back into altcoins that have been battered since the start of the year. Among those bouncing back is the layer 1 token Sui (SUI), which has seen a 57% rise over the past 30 days, trimming its year-to-date losses to just 12%.
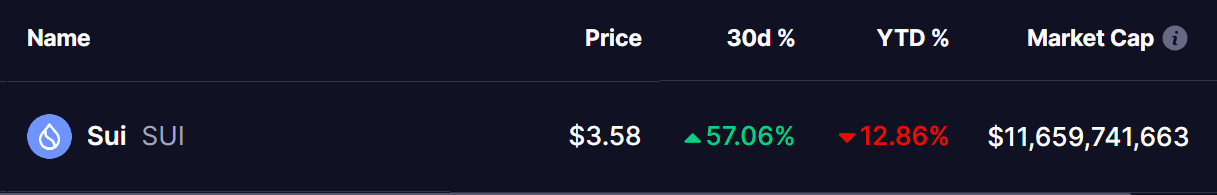 Source: Coinmarketcap
Now, with the market recovering and sentiment shifting, an interesting fractal pattern is forming on the charts. And if history is any guide, SUI could be on the brink of a major breakout.
SUI Mirrors SOL’s Legendary 2021 Path
A new chart comparison by Moralis between Solana (SOL) and Sui (SUI) has caught the attention of crypto analysts and traders—and for good reason. The structure and timing of SUI’s current move look strikingly similar to SOL’s trajectory in the last bull cycle.
Back in 2021, Solana experienced a sharp 69% correction before going absolutely parabolic. From its bottom, SOL exploded 1,451% in market cap, hitting a cycle top of $76 billion. That legendary run made SOL one of the top-performing assets of the year.
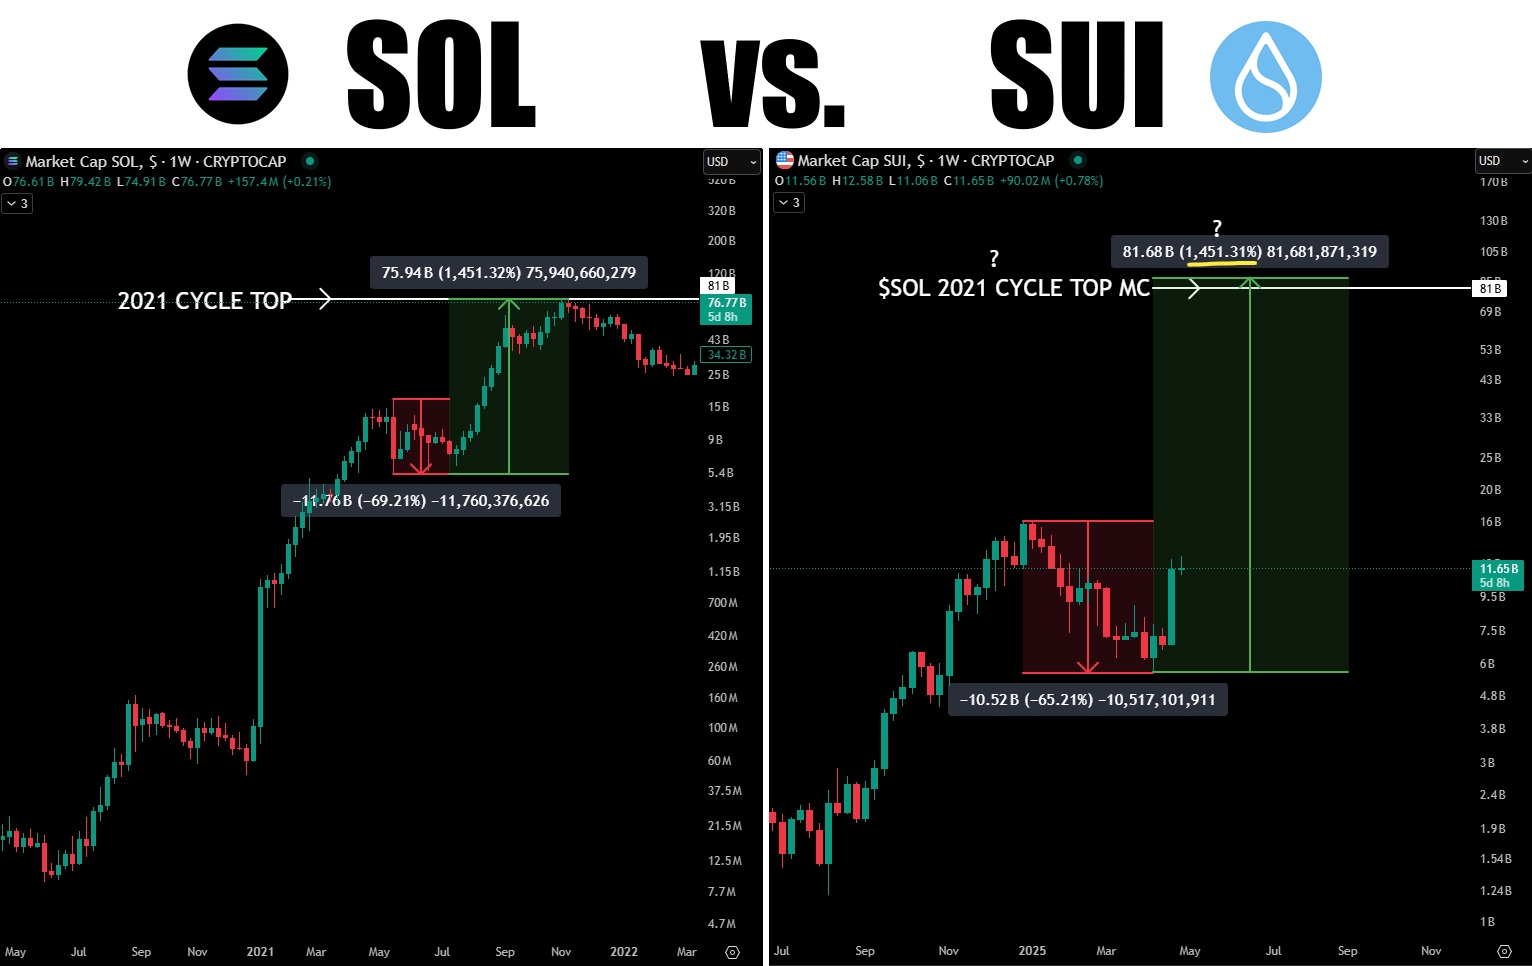 SOL vs. SUI Chart Comparison/Source: @moraliscom (X)
Fast forward to 2025—SUI appears to be following in those footsteps. It recently saw a 65% decline in market cap from its highs, and just like SOL, it’s starting to bounce back with strong momentum. SUI is now trading at a market cap of $11.65 billion and showing signs of accumulation.
If SUI follows the same fractal, the projected move would take it to $81.6 billion in market cap—mirroring SOL’s 2021 cycle top and representing a potential 1,450%+ rally from the recent lows.
Key Fractal Similarities:
Correction Depth:
- SOL dropped 69%
- SUI dropped 65%
Recovery Structure:
- Both assets bounced after a multi-month downtrend
- Both formed clear bottoming candles before reversing
Cycle Target:
- SOL’s top: $76.7B
- If SUI follows the same path: ~$81.6B ($23)
These similarities, highlighted in the side-by-side chart analysis, are what’s fueling speculation that SUI could be the “SOL of this cycle.”
Final Thoughts
Fractals don’t guarantee future results, but they often help identify repeating behavioral patterns in markets. In SUI’s case, the resemblance to SOL’s 2021 breakout is hard to ignore. If the pattern holds, early holders could be in for massive upside.
Still, this setup is speculative. Markets change, and narratives evolve. As always—history rhymes, but doesn’t repeat perfectly. Trade with caution and manage your risk accordingly.
Disclaimer: This article is for informational purposes only and not financial advice. Always conduct your own research before investing in cryptocurrencies.
Disclaimer: The content of this article solely reflects the author's opinion and does not represent the platform in any capacity. This article is not intended to serve as a reference for making investment decisions.
You may also like
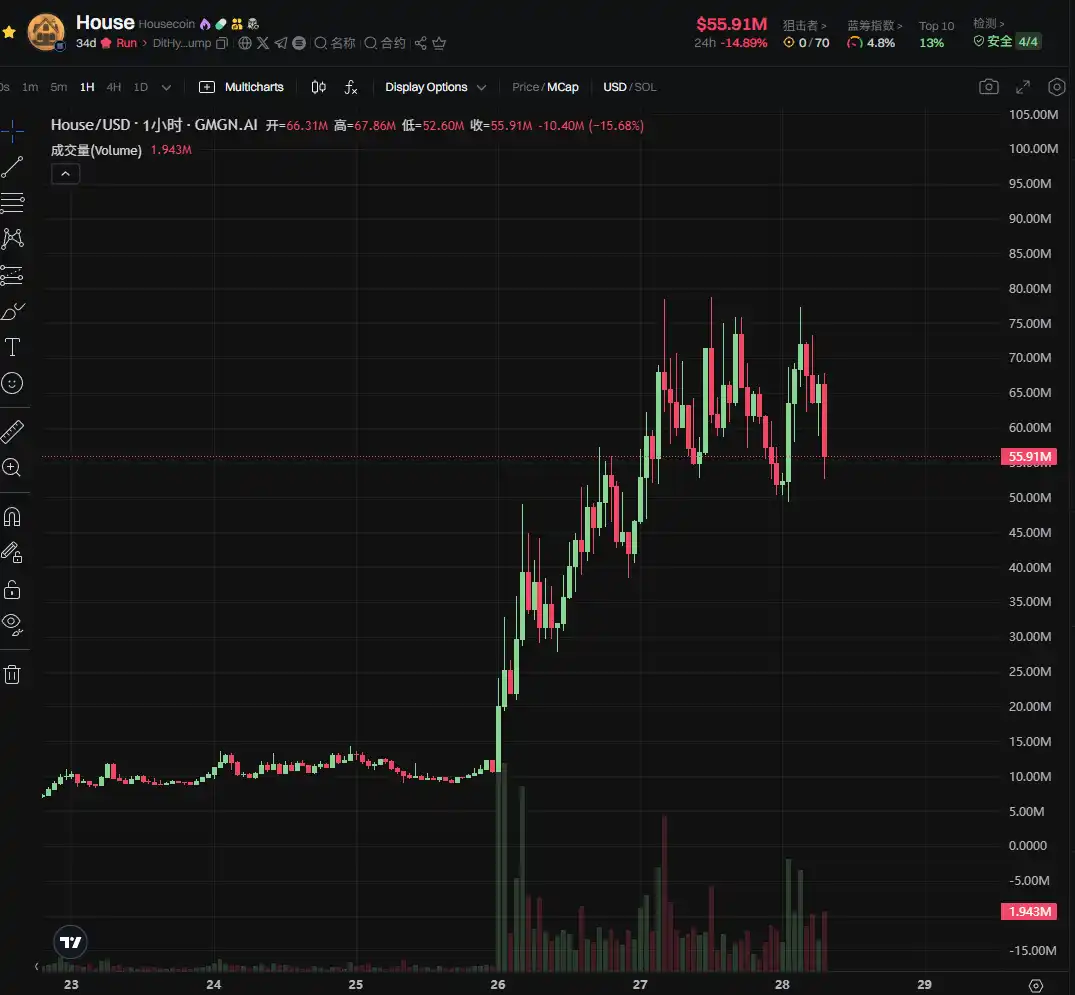
HOUSE Price Skyrockets, This Generation of Young People Engages in Anti-Real-Estate Memes
Custodia CEO Criticizes Fed’s Stablecoin Policy

Is Jupiter (JUP) On the Verge of an Upside Move? This Fractal Says It Might Be!

PEPE Sees Major Whale Accumulation – Will This Fractal Start an Upside Move?