The Graph Price Prediction 2025-35: Will It Hit $50 by 2035?

- The Graph’s token open interest shows increased long positions, hinting at bullish conviction.
- A bullish breakout from GRT’s descending triangle could lift it toward $1.33 resistance.
- GRT’s bullish 2025 forecast ranges between $0.01 and $2.50 post-Bitcoin halving.
The Graph (GRT) Overview
| Cryptocurrency | The Graph |
| Ticker | GRT |
| Current Price | $0.09693 |
| Price Change (30D) | 7.35% |
| Price Change (1Y) | -63.20% |
| Market Cap | $947.65 Million |
| Circulating Supply | 9.77 Billion |
| All-Time High | $2.88 |
| All-Time Low | $0.051710 |
| Total Supply | 10.8 Billion |
What is The Graph (GRT)?
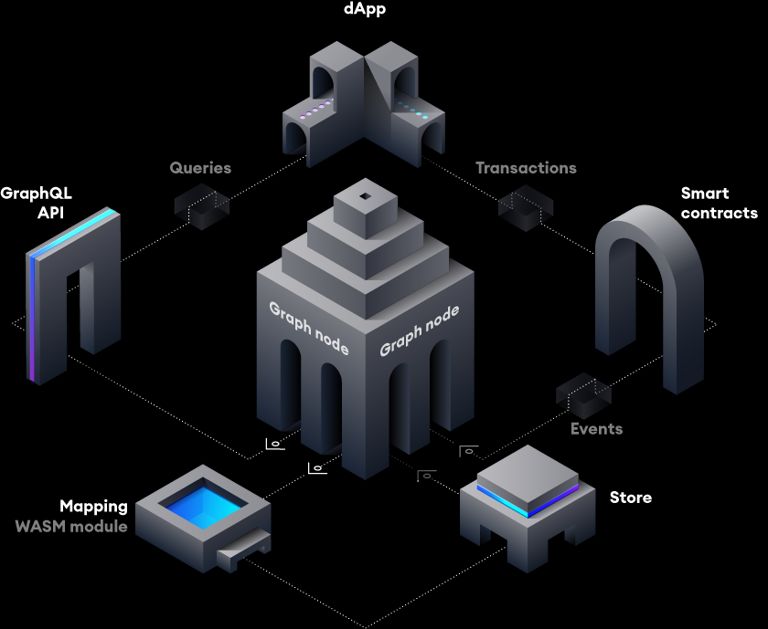
The Graph (GRT) is a decentralized indexing protocol that enables developers to query blockchain data simply, quickly, and securely. Often referred to as the “Google of blockchains,” The Graph transforms how decentralized applications (DApps) access and organize on-chain data, making it readable and usable at scale, without needing to build and maintain proprietary indexing infrastructure.
 Source:
The Graph
Source:
The Graph
At its core, The Graph enables decentralized applications to retrieve data that would otherwise be incredibly time-consuming or technically difficult to access directly from blockchains like Ethereum. For example, querying which wallet owns a Bored Ape NFT filtered by a specific trait would require parsing every transaction and metadata file—something The Graph simplifies instantly through subgraphs, its open APIs.
Why The Graph Matters
Blockchain data is immutable, but it is often hard to access efficiently. The Graph solves this problem with:
- Subgraphs: Modular APIs that index specific smart contract events.
- GraphQL: A flexible query language allowing DApps to fetch the data they need.
- Decentralized Infrastructure: Run by a network of Indexers, Curators, and Delegators to ensure uptime, security, and accuracy.
The Graph’s Ecosystem at Work
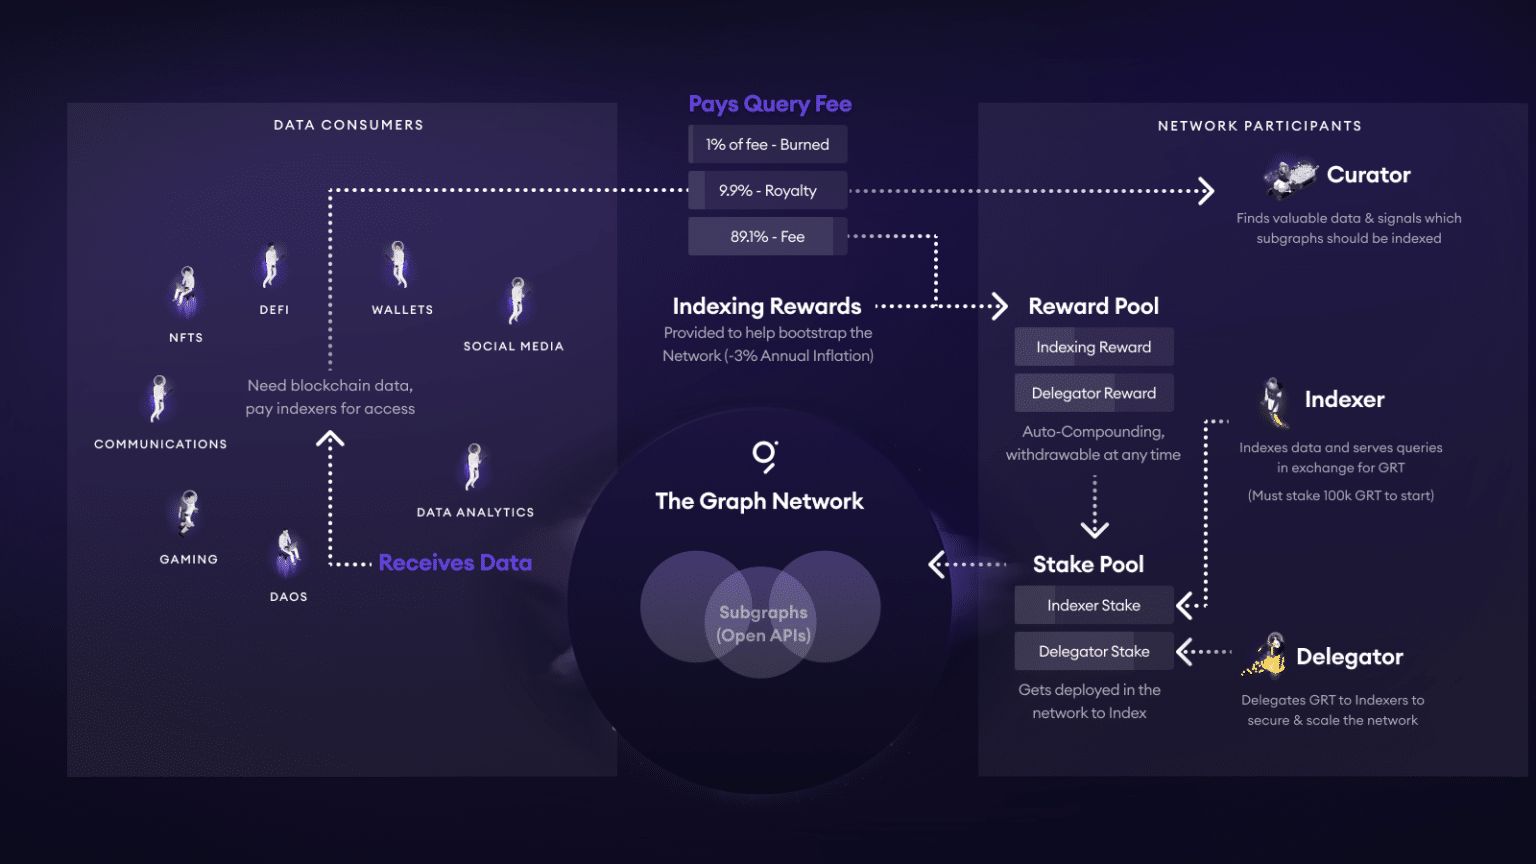
Each actor in The Graph’s ecosystem performs a key role to keep the protocol functioning:
 Source:
The Graph
Source:
The Graph
- Indexers: These are node operators that index data and serve queries. They stake GRT to provide honest and fast service.
- Curators: Experts who signal which subgraphs should be indexed, improving data quality.
- Delegators: Token holders who stake GRT with Indexers to support the network without running infrastructure.
The economic backbone of this system is GRT, an ERC-20 utility token used to:
- Pay for data queries.
- Reward Indexers, Curators, and Delegators for their work.
- Incentivize accuracy and prevent dishonest behavior through slashing mechanisms.
Real-World Use Cases
- Uniswap DeFi: Powering analytics, token swaps, and liquidity stats.
- NFT Marketplaces: Enabling complex filtering and wallet tracking.
- Staking Models: Letting GRT holders participate without technical know-how.
- Web3 DApp Development: Offering fast, reliable access to blockchain data.
What’s Unique About GRT?
- Serverless Experience: No backend is needed to query blockchain data.
- Community-Driven: Governance decisions are made by token holders.
- Scalable Architecture: Support for Ethereum now, and more blockchains soon.
- AI Integration: Future updates will feature AI-powered queries and faster indexing.
The Graph Price History
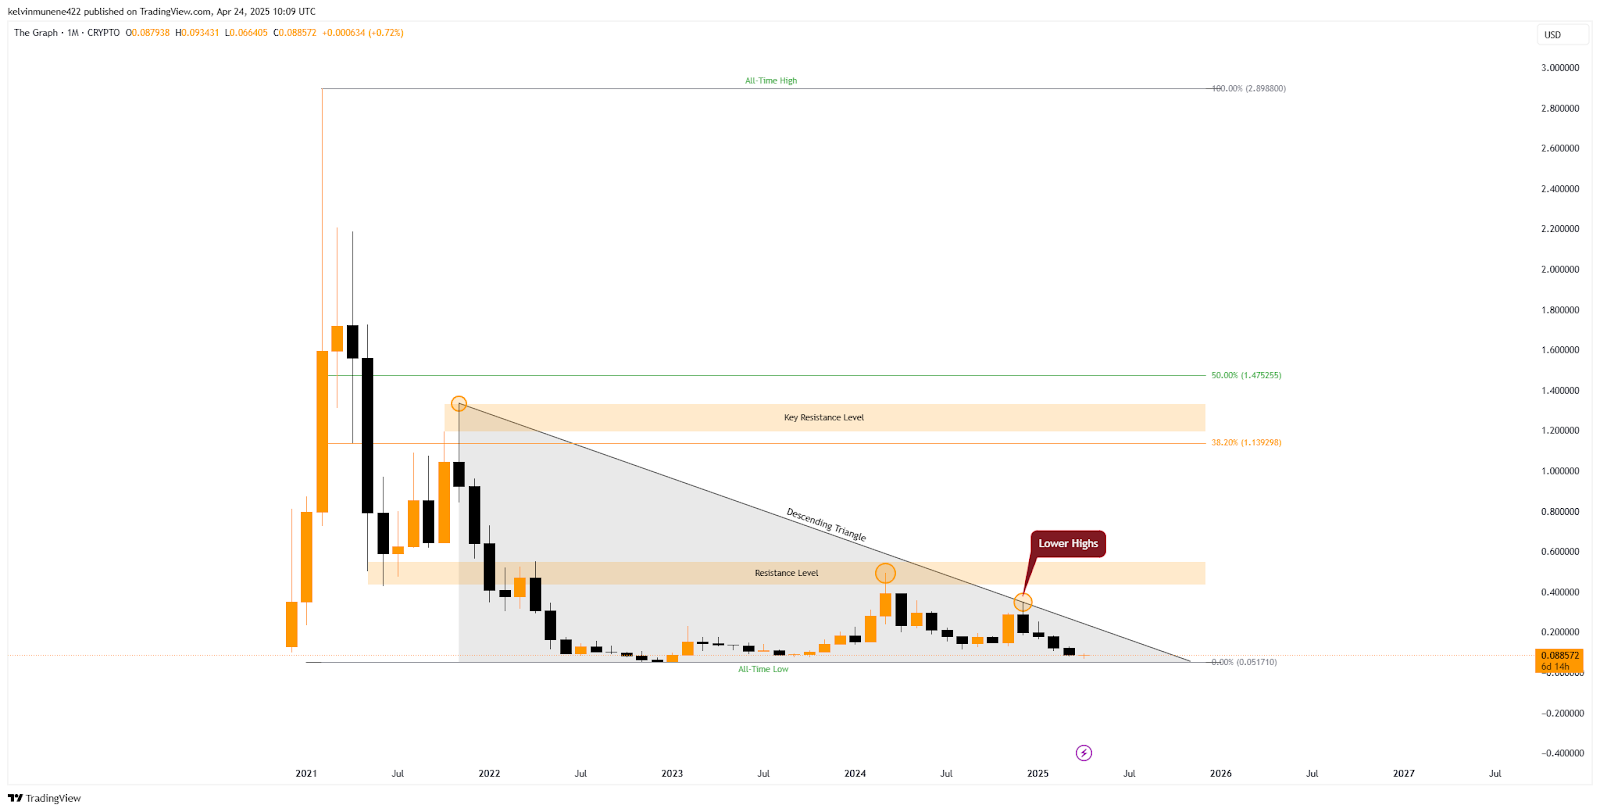
The GRT token, once hailed for its explosive breakout during its early market debut, is now navigating a complex price structure marked by resistance zones, historical retracements, and bearish technical formations. After launching in 2020, GRT recorded a surge of nearly 2,800%, peaking at an all-time high of $2.88. However, that level marked the beginning of a prolonged downturn.
The initial correction saw GRT lose over 85% of its peak value, finding temporary relief in the $0.55 to $0.42 range. This zone served as a support base for a brief recovery. Yet, the bounce was capped by a notable resistance band between $1.33 and $1.19, closely aligned with the 38.2% to 50% Fibonacci retracement levels.
This alignment confirmed the strength of the resistance and triggered another sharp price decline. What was once a support level has now become a ceiling. The token’s price action shows that the $0.55–$0.42 zone has repeatedly rejected upward attempts, becoming a significant barrier.
 Source:
TradingView
Source:
TradingView
Each test of this range has been followed by immediate price corrections, pointing to intense sell pressure and persistent market caution. Besides, technical indicators show a descending triangle pattern on GRT’s price chart.
This structure, characterized by lower highs and a flat support line, often suggests a bearish continuation. If the pattern continues, GRT could retest its all-time low near $0.51. A breakdown below this level might push the token into uncharted territory, triggering fresh lows not seen before.
However, the outlook is not entirely bleak. A decisive bullish breakout above the triangle’s upper trendline and past the $0.42 resistance could reverse the current trajectory. Such a move might ignite a momentum-driven climb toward the $1.33–$1.19 range again, setting the stage for a broader recovery and, potentially, a challenge of its all-time high.
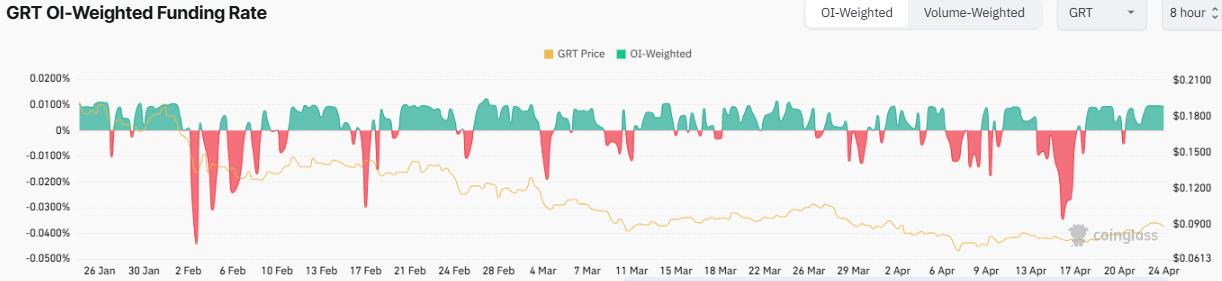
Positive Funding Rate Sparks Hope for GRT Recovery
Building on the current technical outlook, the GRT OI-weighted funding rate chart adds a crucial layer of insight. After a prolonged period of negative funding rates, reflecting short sellers’ dominance, the funding rate has recently shifted into positive territory. This flip signals that long position holders are now willing to pay a premium to short sellers to maintain their trades, an indication of growing confidence among bulls.
 Source:
Coinglass
Source:
Coinglass
The transition in funding rates aligns with the recent stabilization in GRT’s price near its local support levels. Historically, such funding rate reversals have preceded upward movements, reflecting market sentiment shifting from bearish caution to bullish conviction. Traders are showing renewed optimism, anticipating a breakout attempt from the descending triangle pattern that is currently capping the token’s price.
Related: Walrus Price Prediction 2025-35: Will It Hit $50 by 2035?
Yearly Highs and Lows of The Graph
| Year | The Graph Price | |
| High | Low | |
| 2024 | $0.494032 | $113009 |
| 2023 | $0.231810 | $0.055145 |
| 2022 | $0.731155 | $0.051710 |
| 2021 | $2.88 | $0.232600 |
| 2020 | $0.810500 | $0.100300 |
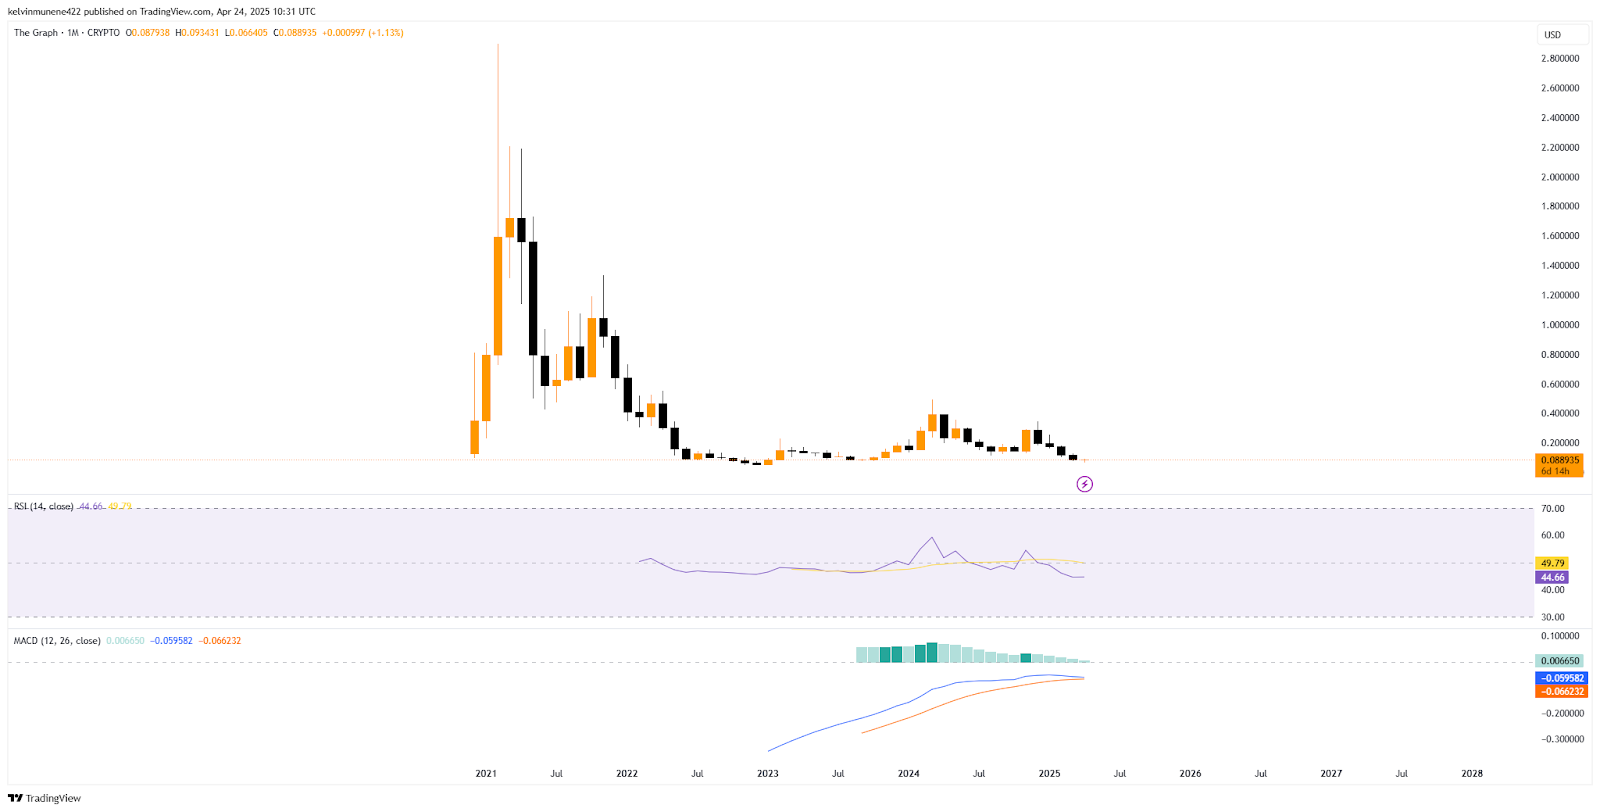
The Graph Technical Analysis
The monthly chart’s MACD for GRT shows a mildly bullish setup, with the MACD line at -0.059582 trading above the signal line at -0.066232. This crossover traditionally signals potential upward momentum. However, the histogram shows fading green bars, and the narrow gap between the lines suggests bullish strength is weakening.
 Source:
TradingView
Source:
TradingView
On the other hand, the Relative Strength Index (RSI) is at 44.66, well below the neutral 50 mark, indicating a neutral-to-bearish trend. This level suggests that the token is neither oversold nor overbought, indicating indecision in the market. However, a drop below 40 would signal increasing selling pressure, while a climb above 50 would be needed to confirm a shift toward bullish momentum.
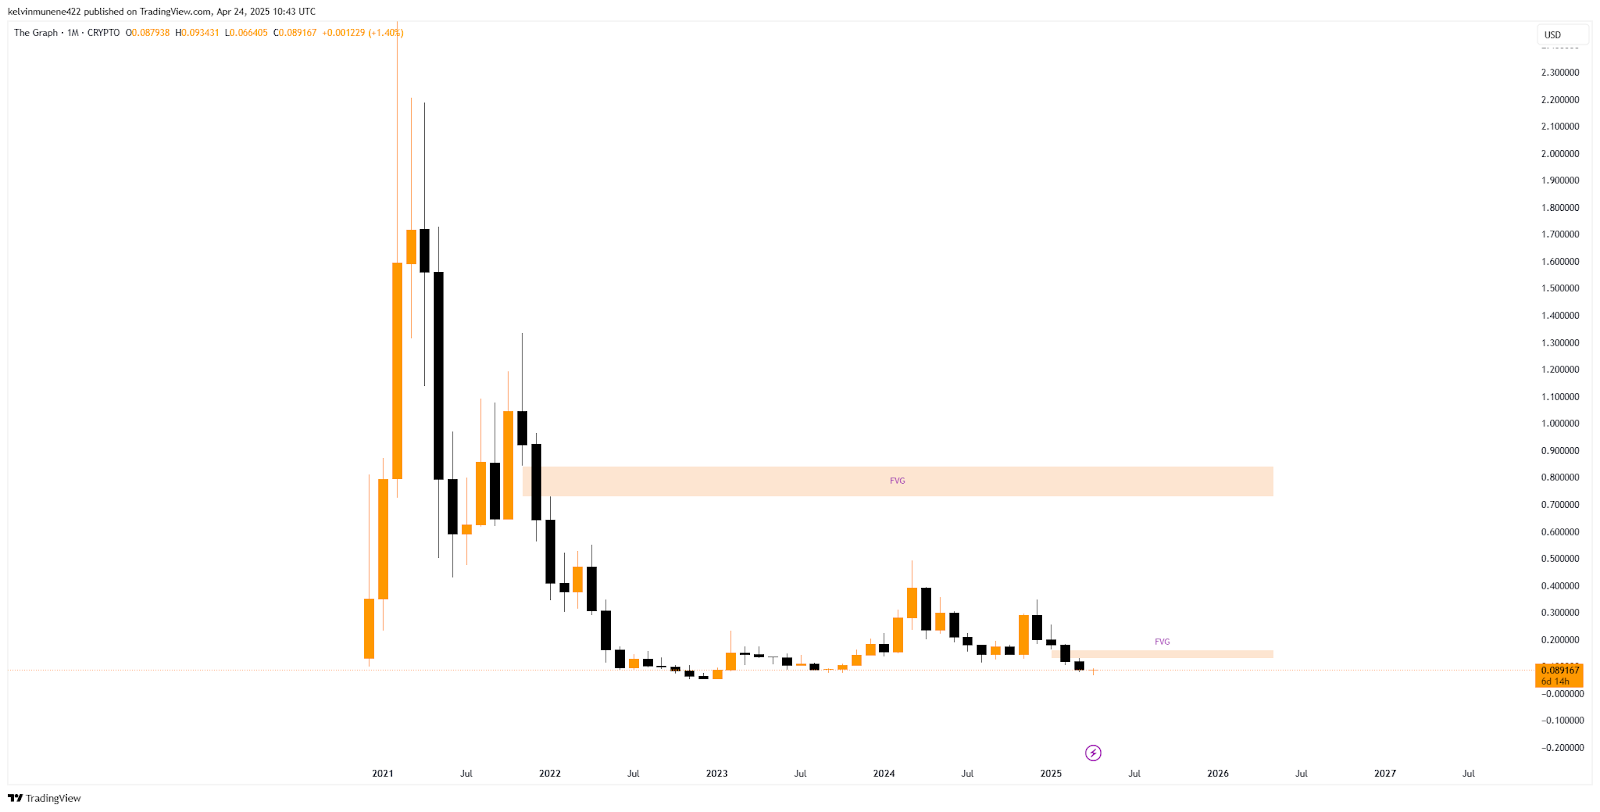
The Graph (GRT) Price Forecast Based on Fair Value Gap
The monthly chart for The Graph (GRT) reveals two key Fair Value Gaps (FVGs) that may influence the token’s future price action. The first and most immediate FVG lies between the $0.16 and $0.13 range, marking an inefficiency in the price movement following a swift drop in mid-2022.
 Source:
TradingView
Source:
TradingView
This FVG currently acts as a magnetic zone for price, offering a possible retracement target if GRT holds above its local support around $0.088. GRT is trading below the lower FVG, and any bullish momentum could push the token into this zone, with the top boundary at $0.16 potentially acting as a resistance.
Historically, FVGs tend to be filled as price retraces to test inefficient areas, suggesting a moderate chance of recovery toward that zone. The second, more distant FVG is between $0.84 and $0.73, established during GRT’s steep decline in 2021. This gap remains untouched and represents a longer-term target, only reachable if the token reclaims significant bullish strength.
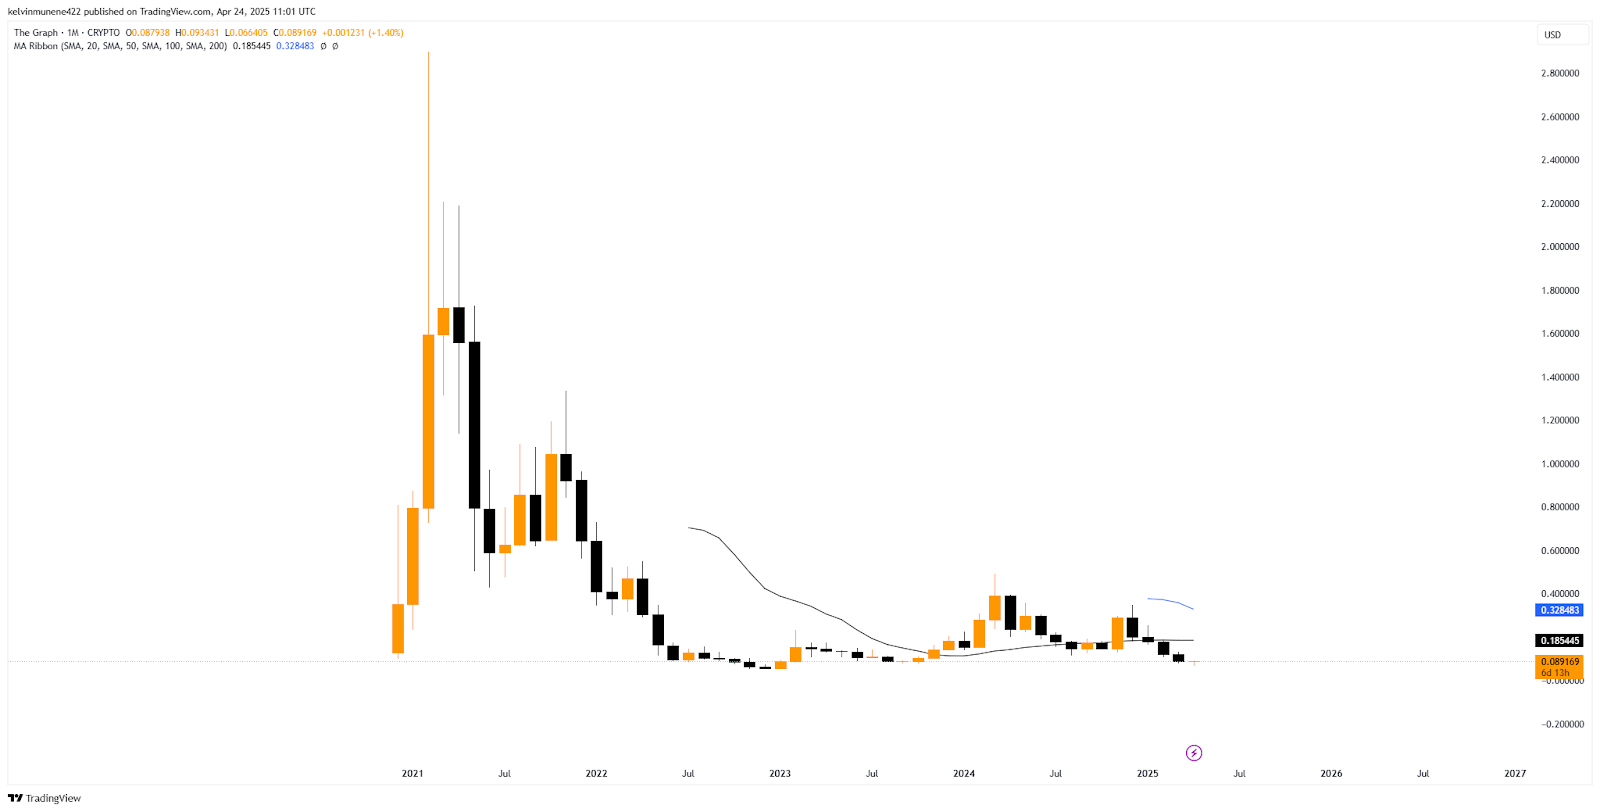
The Graph (GRT) Price Forecast Based on MA Ribbon Analysis
The 20-period moving average (MA) for the GRT token currently sits at $0.1854, while the 50-period MA is at $0.3284, significantly above the token’s market price of $0.0891. This alignment confirms a clear bearish trend, as price action remains suppressed beneath both short- and mid-term moving averages.
Notably, the 20 MA trades below the 50 MA, reinforcing continued downside pressure. However, the distance between the two moving averages is narrowing, signaling a potential momentum shift. This convergence suggests that selling pressure may be easing, and a crossover could occur in the coming months if bullish sentiment returns.
 Source:
TradingView
Source:
TradingView
Historically, such tightening between the 20 and 50 MAs has preceded trend reversals, making this a critical development to monitor. GRT’s recent failure to retest even the 20 MA reflects broader market hesitation and a lack of sustained buying volume.
For any bullish move to be validated, the token must close multiple sessions above the 20 MA, flipping it into support. Until that happens, the current MA ribbon setup confirms that GRT remains technically weak.
The Graph (GRT) Price Forecast Based on Fib Analysis
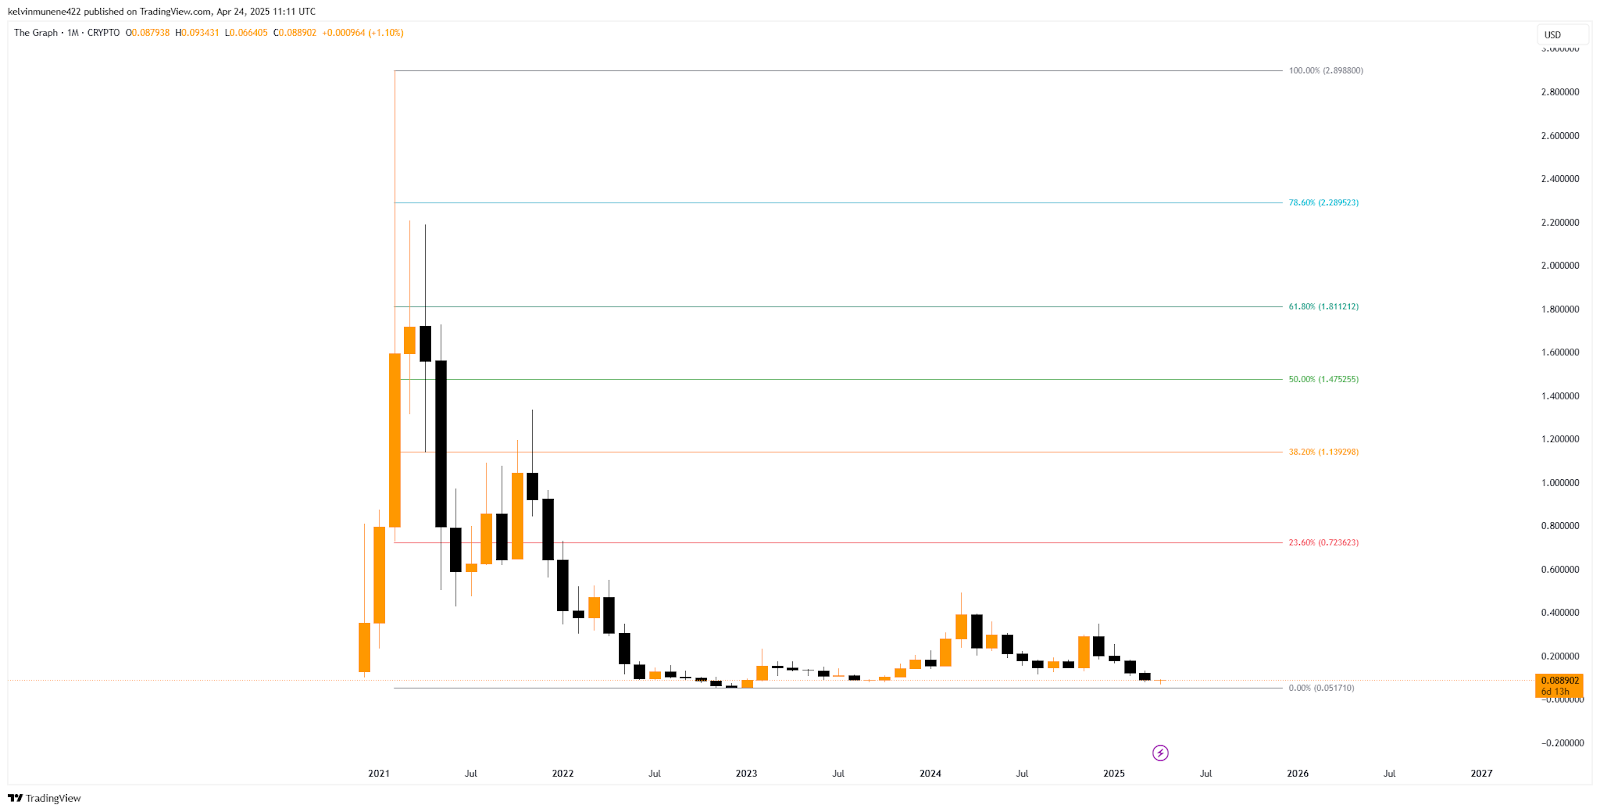
The GRT token is trading below all key Fibonacci retracement levels and is approaching the 0% level at $0.0517, which represents its macro support. This confirms the token is deeply oversold, making any reversal heavily dependent on strong bullish momentum.
In a bullish breakout scenario, the first resistance to overcome would be the 23.6% Fib level at $0.7236. This zone is historically significant as prior attempts to break through it have failed. A close above it would signal early strength in market demand.
 Source:
TradingView
Source:
TradingView
The next target would be the 38.2% retracement at $1.1392, a zone closely tied to previous rejection and selling activity. This could attract short-term profit-taking. Pushing further, the 50% level at $1.4753 stands as a psychological midpoint of the macro range. A breakout above this could confirm a long-term trend reversal.
Beyond that, the 61.8% golden ratio at $1.8112 represents a critical level often tied to strong technical resistance. The final barrier, the 78.6% Fib at $2.2895, must be cleared before any retest of the 100% all-time high at $2.8988 is possible.
The Graph (GRT) Price Prediction 2025
According to CryptoTale, GRT could enter an intense bullish phase following the 2024 Bitcoin halving. Renewed investor interest and increased blockchain data usage may drive the token beyond its previous resistance, revisiting a high around $0.01-$2.50.
The Graph (GRT) Price Prediction 2026
As per our forecast, 2026 could be a correction year for the broader crypto market. After the previous year’s surge, overvaluation and fading hype may lead to a drop in GRT’s value as the market cools. As a result, the token could range between $1.00 and $2.00.
The Graph (GRT) Price Prediction 2027
CryptoTale projects that GRT may experience prolonged weakness toward the $0.50- $1.50 range as the market bottoms out. Sentiment may remain low, but subtle signs of recovery may emerge late in the year in anticipation of the next Bitcoin halving cycle.
The Graph (GRT) Price Prediction 2028
Our outlook suggests that GRT could begin a slow and steady recovery in 2028. Growing optimism about blockchain adoption and anticipation of the fifth BTC halving event may lead to renewed token accumulation, which would cause the token’s price to surge between $2.50 and $5.00.
The Graph (GRT) Price Prediction 2029
According to CryptoTale, GRT may benefit from post-halving hype and increasing investor participation. Broader adoption of decentralized applications and enhanced indexing demand could drive the token into a new expansion phase within the $4.00-$10.00 range.
The Graph (GRT) Price Prediction 2030
The market may correct after the 2029 expansion, leading to a pullback in GRT’s value. Profit-taking and a cooling cycle across altcoins could dominate sentiment, temporarily stabilizing prices at lower levels, around $3.50-$8.00.
The Graph (GRT) Price Prediction 2031
As projected, the market could stabilize and begin a slow recovery this year. With the 2032 halving approaching, investor confidence may improve. GRT could see moderate growth toward the $3.00-7.00 levels amid rising interest in blockchain utility tokens.
The Graph (GRT) Price Prediction 2032
CryptoTale anticipates a strong bullish surge to $6.00-$15.00 as the Bitcoin halving ignites a new market cycle. GRT may benefit from increased market activity and stronger attention on data-centric protocols in a rapidly expanding Web3 space.
The Graph (GRT) Price Prediction 2033
Our forecast shows GRT could experience rapid growth as the post-halving expansion peaks. Mainstream integration of blockchain services may boost demand for decentralized data access, fueling a robust rally toward $15.00-$30.00.
The Graph (GRT) Price Prediction 2034
This year, the crypto sector may experience a slight pullback as investors take profits. GRT could face short-term resistance, but its core utility and ecosystem strength may help it maintain a stable range within $12.00-$25.00.
The Graph (GRT) Price Prediction 2035
CryptoTale expects another bullish surge for GRT as the token capitalizes on strong market momentum. Continued expansion in decentralized infrastructure may push the token to new all-time highs around $25.00-$50.00 by the end of the year.
Related: DeXe Price Prediction 2025-35: Will It Hit $250 by 2035?
FAQs
What is GRT?
GRT is the native token of The Graph, a decentralized protocol for indexing and querying blockchain data via open APIs called subgraphs.
How can I purchase GRT?
GRT can be purchased using fiat, stablecoins, or other cryptocurrencies on major crypto exchanges like Binance, Coinbase, and Kraken.
Is investing in GRT a wise decision?
GRT offers utility in Web3 data indexing and has long-term potential, but investing depends on market conditions and individual risk tolerance.
What’s the best way to securely store GRT?
For maximum protection of GRT holdings, use hardware wallets like Ledger or Trezor, or secure software wallets with private key access.
Who is the founder of GRT?
The Graph was founded by Yaniv Tal, Brandon Ramirez, and Jannis Pohlmann to improve access to blockchain data.
Which year was GRT launched?
GRT launched in 2020 as the native token powering The Graph’s decentralized indexing and query infrastructure.
What is GRT’s circulating supply?
GRT has a circulating supply of approximately 9.77 billion tokens out of a total supply of 10.8 billion.
Will GRT surpass its all-time high?
According to long-term forecasts, GRT could surpass its all-time high of $2.88 by 2028 due to market cycles and adoption.
What is GRT’s lowest price?
The all-time low for GRT is $0.051710, recorded during a market downturn and major correction phase.
What will the price of GRT be in 2025?
In 2025, GRT could trade between $0.01 and $2.50, driven by Bitcoin halving momentum and renewed investor interest.
What will the price of GRT be in 2028?
GRT may range from $2.50 to $5.00 in 2028 as recovery momentum and optimism surrounding blockchain adoption grow.
What will the price of GRT be in 2030?
Following a post-expansion correction, GRT could stabilize between $3.50 and $8.00 as market conditions cool and investors take profits.
What will the price of GRT be in 2032?
In 2032, GRT could surge to $6.00–$15.00, benefiting from renewed bullish sentiment following the next Bitcoin halving event.
What will the price of GRT be in 2035?
By 2035, GRT could reach $25.00–$50.00, driven by expanded decentralized infrastructure and long-term adoption across blockchain-based services.
The post The Graph Price Prediction 2025-35: Will It Hit $50 by 2035? appeared first on Cryptotale.
Disclaimer: The content of this article solely reflects the author's opinion and does not represent the platform in any capacity. This article is not intended to serve as a reference for making investment decisions.
You may also like
Meta Launches Meta AI Application
US Senators Introduce the American Blockchain Deployment Act of 2025
Loopscale: All stolen funds have been recovered and no user assets have been lost
Lombard and Eigenlayer partner to bring Bitcoin restaking to Ethereum