
Last updated: April 11, 2025 15:58 EDT
Polkadot Plunges 12% as Bulls Retreat Despite Growing Institutional Backing and Academic Breakthroughs
By:Jimmy Aki
Polkadot is bucking the market trend, facing headwinds with a sharp 12% decline and a noticeable dip in network activity. Nevertheless, growing interest from ETFs and its incorporation into educational platforms hint at potential for long-term growth.
Disclaimer: Crypto is a high-risk asset class. This article is provided for informational purposes and does not constitute investment advice. You could lose all of your capital.

Although crypto prices had briefly bounced earlier this month, overall market sentiment remained fragile throughout the period.
Polkadot (DOT) dropped over 12% this past week as risk sentiment weakened, even as institutional filings and academic partnerships attempted to bolster confidence in the network.
On-Chain Metrics Show Drop in Polkadot Activity
Amid broader weakness, core metrics on the Polkadot network deteriorated.
Token Terminal data showed a drop of more than 18% in active addresses over the past 30 days. Trading volume also fell over 24% during the same timeframe.
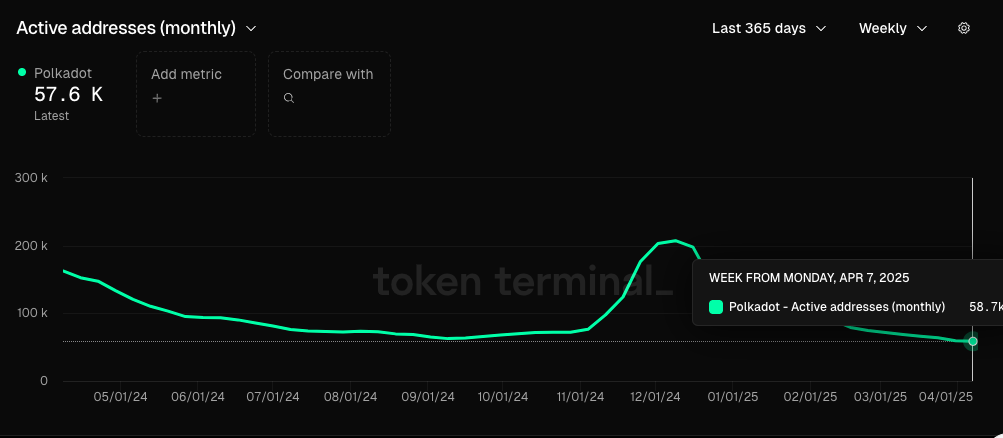 Polkadot active address/ Source: Token Terminal
These figures align with reduced engagement seen across much of the crypto market in recent weeks.
Open interest in Polkadot futures, however, moved in the opposite direction. According to Messari , the figure has climbed back toward $300 million.
This may indicate that some market participants are positioning for possible price fluctuations or short-term movement.
Institutional Interest and Academic Expansion in Polkadot
Grayscale Investments submitted a filing with the U.S. Securities and Exchange Commission (SEC) in February to list a Polkadot ETF on Nasdaq.
A similar proposal followed in March from 21Shares, which named Coinbase as the custodian for its planned Polkadot ETF on the Cboe BZX Exchange.
In parallel with these filings, Polkadot has also seen developments in the education sector.
Switzerland’s Lucerne University of Applied Sciences and Arts (HSLU) announced the inclusion of Polkadot Blockchain Academy content in its academic programs, both technical and non-technical.
Polkadot Technical Chart Suggests Rebound Attempt
DOT recently fell through a key support range between $3.80 and $4.00, reaching a five-month low of approximately $3.30.
 $DOT painting bearish signal/ source: TradingView
Following the plunge, $DOT has managed to bounce back slightly and is now trading near $3.51.
It has since stabilized near $3.51. This level is close to a previously active support zone that was associated with upward movement in late 2024.
MACD data shows early signs of a potential bullish crossover, a common indicator used to track changes in momentum.
While not a confirmation of trend reversal, the signal could suggest a pause in selling pressure.
If price reclaims the $3.80 level, it may indicate that the recent breakdown lacked follow-through.
A return above that threshold could bring attention back to the $4.20 level observed earlier this year.
0
0
Disclaimer: The content of this article solely reflects the author's opinion and does not represent the platform in any capacity. This article is not intended to serve as a reference for making investment decisions.
PoolX: Locked for new tokens.
APR up to 10%. Always on, always get airdrop.
Lock now!
You may also like
Amir Bandeali Stays True to Code as Co-CEO of 0x
CryptoNewsFlash•2025/04/15 06:11

Bitcoin Hash Rate Reaches Record High
Bitcoin's hash rate just hit a new all-time high, signaling strong network security and growing miner confidence.What the Record Hash Rate Really MeansA Surge Driven by Miner OptimismPre-Halving Momentum Builds
Coinomedia•2025/04/15 06:11

Bitcoin Nears $85K Amid Trade Optimism and Fed Hints at Rate Cuts
Bitget Academy•2025/04/15 05:20
Trade wars push blockchain into supply chain solutions
Grafa•2025/04/15 04:01

Trending news
MoreCrypto prices
MoreBitcoin
BTC
$85,729.21
+1.56%
Ethereum
ETH
$1,644.47
+1.29%
Tether USDt
USDT
$0.9998
+0.02%
XRP
XRP
$2.15
+1.50%
BNB
BNB
$589.84
+0.11%
Solana
SOL
$131.78
-0.02%
USDC
USDC
$0.9999
+0.01%
TRON
TRX
$0.2516
-1.51%
Dogecoin
DOGE
$0.1601
-2.12%
Cardano
ADA
$0.6442
+1.03%
How to sell PI
Bitget lists PI – Buy or sell PI quickly on Bitget!
Trade now
Become a trader now?A welcome pack worth 6200 USDT for new Bitgetters!
Sign up now