
Last updated: April 11, 2025 15:42 EDT
Bollinger Bands Inventor Just Flagged a Bitcoin Reversal Pattern Near $80K
By:Arslan Butt
Disclaimer: Crypto is a high-risk asset class. This article is provided for informational purposes and does not constitute investment advice. You could lose all of your capital.

Bitcoin is flashing early signs of a potential trend reversal as it trades around $83,780, up over 1.5% on the day. Technical analysts are now focused on a “W-bottom” formation highlighted by none other than John Bollinger, the creator of Bollinger Bands.
In a TradingView post shared on April 10, Bollinger identified this setup on the weekly BTC/USD chart, noting it still requires confirmation before traders can act with conviction.
“Classic Bollinger Band W bottom setting up in $BTCUSD. Still needs confirmation,” Bollinger posted on Twitter .
On the weekly chart, Bitcoin dipped below the lower Bollinger Band before recovering above support near $70,000—a price structure often associated with trend reversals. To validate this setup, BTC must close above its 20-week simple moving average, currently near $84,000.
Macro and Market Correlation Keep Pressure in Play
While the chart signals optimism, broader market sentiment remains mixed. Bitcoin continues to track U.S. equity trends, especially the Nasdaq 100 and S&P 500.
According to Fidelity’s Jurrien Timmer, the S&P recently fell from two standard deviations above its trend to two below—a potential sign of oversold conditions but not yet a decisive reversal.
Economist Timothy Peterson adds that Bitcoin may still lag the recovery in equities. Historically, BTC leads in downturns but trails during rebounds.
For Peterson, any sustainable upside in Bitcoin hinges on a risk-on shift in the stock market and confirmation that macroeconomic headwinds—especially interest rate volatility—are easing.
Key Support Levels for Bitcoin’s Reversal
Bitcoin’s performance at the $70,000 mark is critical, not just as a psychological barrier but also as a key liquidity level.
Market observers are paying close attention to this support zone, with the $69,000 level previously identified as a critical threshold by Peterson’s Lowest Price Forward model.
Although the model initially predicted a 95% likelihood of the $69,000 support holding, current macroeconomic factors suggest more caution.
Bitcoin Breaks $83.5K Resistance, Eyes $86.4K as Bullish Momentum Builds
Bitcoin (BTC/USD) is trading near $83,780 after breaking above the key $83,560 resistance zone, previously acting as a ceiling within the symmetrical triangle.
The move is supported by a clean break above the 50 EMA at $80,920, signaling bullish momentum.
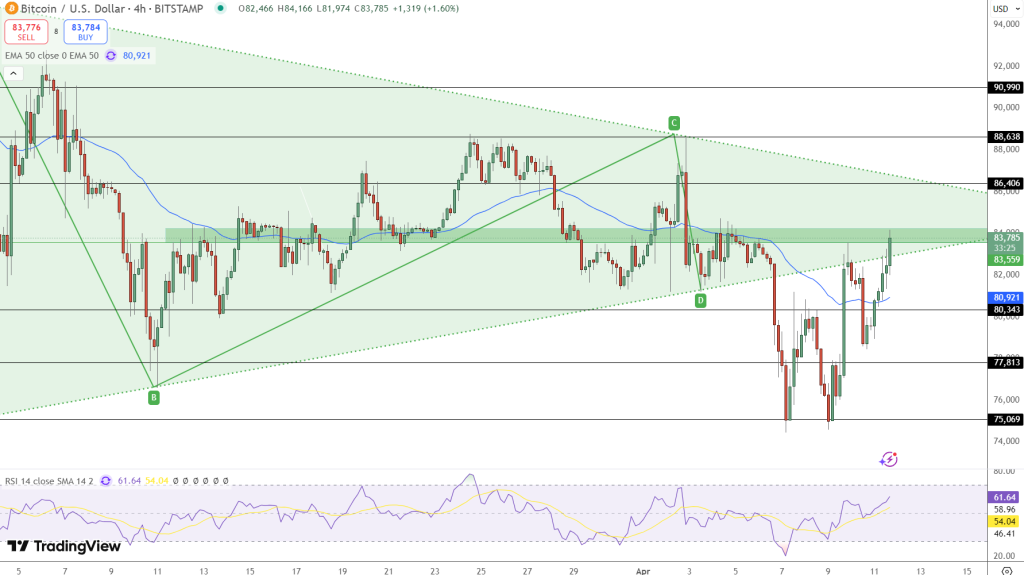
The RSI is holding around 62, suggesting further upside before overbought conditions emerge. If buyers maintain control, the next resistance targets sit at $86,400 and $88,600. A retest of $83,560 could serve as a support confirmation.
$70K Support Holds, But $84K Is the Real Test
- Support Zones: $80,900 (50 EMA), $80,000, $77,800
- Resistance Targets: $83,560 (broken), $86,400, $88,600
- Momentum Indicator: RSI at 62 – bullish, but not overbought
- Breakout Trigger: A confirmed close above $84,000 could ignite momentum toward $91,000
Bitcoin’s short-term trend remains bullish after reclaiming the 50-day EMA and breaking above the triangle resistance at $83,560. However, price action around $84,000—the mid-Bollinger band and psychological level—will be key to confirming the reversal pattern Bollinger described.
Conclusion
Bitcoin’s price action is approaching a technical tipping point. If the W-bottom pattern completes and BTC closes decisively above $84K, the path toward $86.4K and $88.6K becomes more likely. With macro sentiment stabilizing and John Bollinger flagging a classic setup, all eyes are now on this crucial resistance level.
BTC Bull Presale: Earn Real Bitcoin with Every Price Milestone
BTC Bull ($BTCBULL) is gaining traction as one of the most exciting presales in crypto, combining meme culture with real utility. Designed for long-term holders, the token automatically rewards investors with real Bitcoin as BTC reaches major price thresholds—aligning community incentives with Bitcoin’s growth.
Staking for Passive Bitcoin Income
BTC Bull offers a lucrative staking program boasting a 119% APY, allowing users to earn passive income while supporting the network. With over 882.5 million BTCBULL tokens already staked, community engagement continues to grow.

Latest Presale Updates:
- Current Token Price: $0.002455 per BTCBULL
- Raised So Far: $4.5M of $5.23M target
With limited time remaining and demand accelerating, this is a key window to secure BTCBULL at presale rates before the next price jump.
0
0
Disclaimer: The content of this article solely reflects the author's opinion and does not represent the platform in any capacity. This article is not intended to serve as a reference for making investment decisions.
PoolX: Locked for new tokens.
APR up to 10%. Always on, always get airdrop.
Lock now!
You may also like
Bessant and Musk sparked a power struggle, and the head of the IRS will be removed from office
Cointime•2025/04/18 19:00
DAC Platform and Fomoin Partner to Gamify Web3 Engagement and Rewards
CryptoNewsNet•2025/04/18 17:55
Andreessen Horowitz’s Crypto Unit (a16z) Purchases $55M in ZRO Tokens
CryptoNewsNet•2025/04/18 17:55
Trending news
MoreCrypto prices
MoreBitcoin
BTC
$84,521.23
-0.45%
Ethereum
ETH
$1,592.4
+0.70%
Tether USDt
USDT
$0.9999
-0.01%
XRP
XRP
$2.08
+0.18%
BNB
BNB
$593.05
+0.19%
Solana
SOL
$133.86
-0.32%
USDC
USDC
$1
+0.00%
Dogecoin
DOGE
$0.1582
+0.70%
TRON
TRX
$0.2409
-2.95%
Cardano
ADA
$0.6270
+1.09%
How to sell PI
Bitget lists PI – Buy or sell PI quickly on Bitget!
Trade now
Become a trader now?A welcome pack worth 6200 USDT for new Bitgetters!
Sign up now