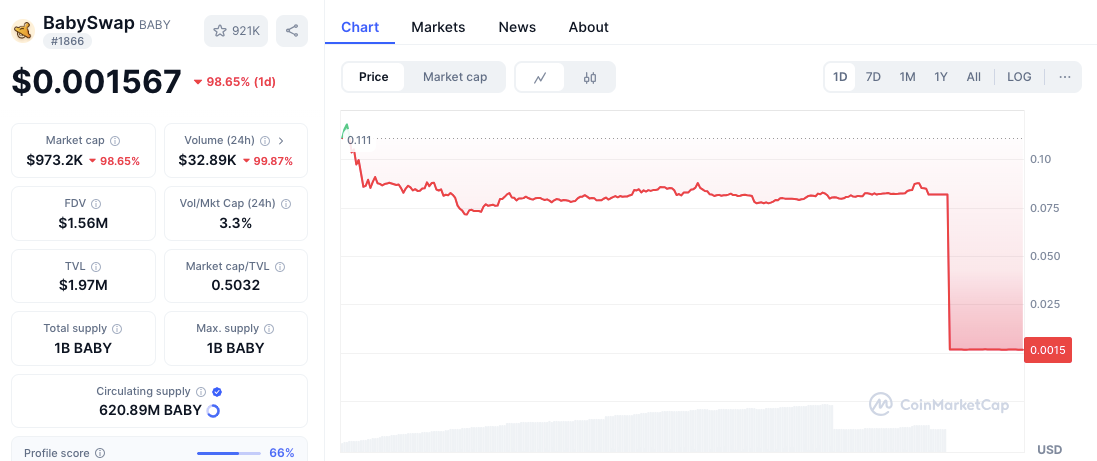
- BABY token crashes 98.60%, now hovering near $0.0015 with minimal support below
- Technical indicators show early bullish signs despite extreme bearish sentiment
- Resistance at $0.0050 and $0.0100 may cap any short-term recovery in BABY price
BabySwap (BABY) has faced an extraordinary collapse, losing nearly all of its value within a short period. Once trading around $0.11, the token now sits near $0.001567 a 98.60% drop. This sharp decline has shaken investor confidence and raised questions about the project’s future.
While the plunge suggests panic selling or a fundamental breakdown, technical indicators are starting to flash early signs of a potential rebound. This mix of destruction and faint recovery signsis is worth a closer look.
BABY’s Crash: What Caused the Near-Total Wipeout?
The extreme downward move lacked any consolidation, which typically signals forced selling or an external shock. Situations like this often result from team exits, token contract issues, or an abrupt exchange delisting.
Related: Bitcoin, Altcoins Fall as US Tariff Hike on China Spooks Global Markets
Low 24-hour trading volume ($32.9K) also shows trader lack of interest and worry. With a market cap reduced to roughly $973.51K, BABY trades at microcap size, adding to price swing risk and making its path hard to guess.
Where is BABY’s Price Floor? Key Support Resistance Levels Now
BABY currently holds just above its closest support around $0.0015. If this breaks, it could fall to $0.0010, a key psychological level. Beyond that, $0.0005 becomes the next logical floor. These levels lack strong historical backing, making downside moves potentially severe.
 Source: CoinMarketCap
Related: Four Altcoins, Four Stories: XRP, TAO, ETH, HBAR Set for Critical April?
On the flip side, resistance levels are significantly spaced out. The first meaningful hurdle lies at $0.0050, which may act as a recovery checkpoint. The $0.0100 level serves as a halfway mark from the crash and could trigger heavy selling pressure. The original high of $0.111 remains out of realistic reach unless a major project overhaul occurs.
Key Technical Indicators: Signs of Stabilization?
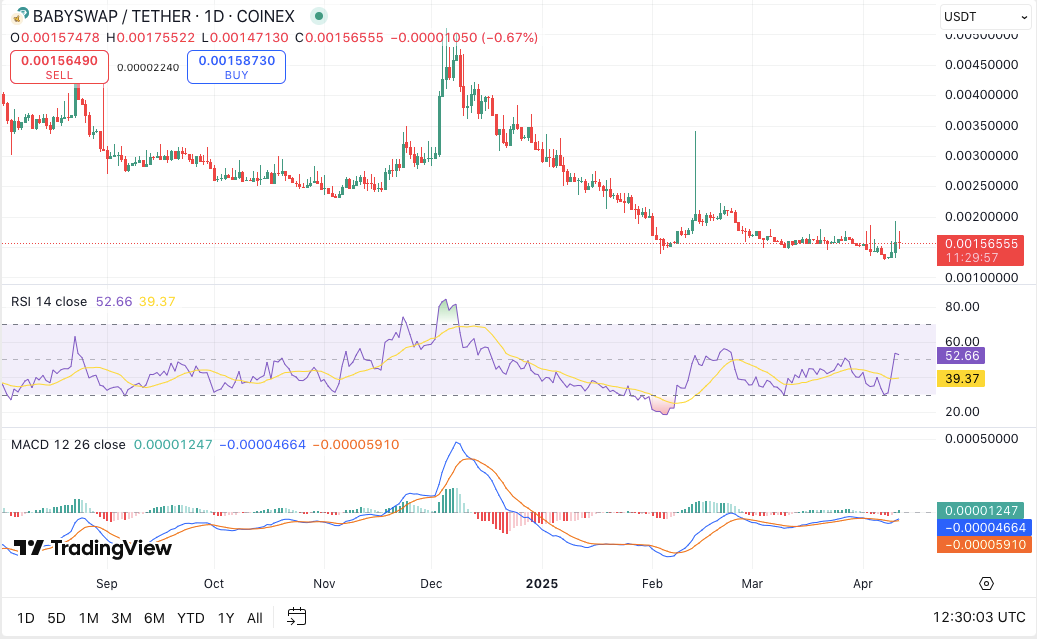 BABY/USD daily price chart, Source: TradingView
Contradiction: Why Tech Indicators Flash Potential Bounce for BABY
Despite the crash, technical signals suggest short-term bullish momentum. The Relative Strength Index (RSI) has climbed to 52.63 from a recent low of 39.37, indicating recovering demand.
Additionally, the MACD indicator has shown a bullish crossover. The histogram is turning green, and momentum is tilting upward.
Disclaimer: The information presented in this article is for informational and educational purposes only. The article does not constitute financial advice or advice of any kind. Coin Edition is not responsible for any losses incurred as a result of the utilization of content, products, or services mentioned. Readers are advised to exercise caution before taking any action related to the company.