Is XRP Gearing Up for a Bullish Reversal? This Fractal Says Yes!

Date: Thu, April 10, 2025 | 12:47 PM GMT
The cryptocurrency market has faced a sharp correction phase, where Ethereum (ETH) itself recorded its worst Q1 decline since 2018 — plummeting by a staggering 56% this year. This widespread weakness has weighed heavily on altcoins , triggering sharp drops and investor concerns across the board.
Among the altcoins, XRP has shed 12% of its value in the last 90 days. But the market is now showing signs of life, especially after U.S. President Trump’s surprise announcement of a 90-day pause on tariffs — pushing sentiment higher and triggering sharp gains across the board, including a 10% jump for XRP in the past 24 hours.
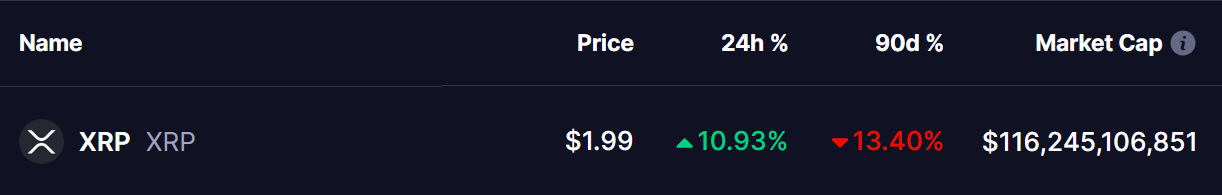 Source: Coinmarketcap
Now, eyes are turning to XRP — because its current price setup is beginning to look strikingly similar to Chainlink’s (LINK) just before its massive breakout in late 2024.
XRP Chart Mirrors LINK’s Past Price Behavior
In the chart below, we can clearly see the fractal comparison between LINK’s 2024 breakout and XRP’s current setup.
On the left, Chainlink formed a textbook head-and-shoulders pattern while declining, eventually bottoming out near a gray demand zone around $8.50. What followed was explosive — a 200%+ rally to $30, backed by a bullish MACD crossover and a reclaim of the 50-week moving average. These indicators signaled a powerful shift in trend and sentiment, which pulled in new buyers and triggered a breakout rally that stunned the market.
Fast forward to now — XRP’s chart (on the right) is showing the same classic reversal structure. The head-and-shoulders formation is clear, with the price bouncing from a key demand zone near $1.54. XRP has since reclaimed the $2.00 level, and more importantly, the MACD indicator has just printed a bullish crossover below the zero line — the same signal that preceded LINK’s surge.
As for what could confirm the move, XRP’s 50-day moving average is currently hovering near $2.28. A move above that level could further validate this reversal and open the door for more upside. This breakout above the moving average would echo LINK’s past price action and reinforce growing momentum. It would also likely attract more technical buyers who have been waiting on the sidelines for a solid confirmation.
What’s Next for XRP?
Of course, no two patterns play out exactly the same way — but in crypto, history tends to rhyme. And this particular rhyme looks loud and clear.
According to the fractal comparison, there may still be a few weeks of consolidation left before XRP attempts a full breakout — a natural and often healthy part of a bullish reversal setup. But if it does manage to take out the $2.17 resistance zone, the path could open for a much larger rally. A breakout at this level could push XRP toward the $3.50 mark and beyond in the coming weeks.
With momentum shifting, price reclaiming key levels, and a nearly perfect echo of Chainlink’s previous pattern, XRP may be on the verge of its own explosive move. The technicals are aligning — and if history is any guide, bulls could soon be back in full control.
Disclaimer: This article is for informational purposes only and not financial advice. Always conduct your own research before investing in cryptocurrencies.
Disclaimer: The content of this article solely reflects the author's opinion and does not represent the platform in any capacity. This article is not intended to serve as a reference for making investment decisions.
You may also like
BTC Weekly Candle Closes at $80K After Bounce From 74.4K Support

Hedera price targets $0.19 after brief 1% spike

Dogecoin price set for 364% rally as RSI breakout pattern emerges
Grayscale expands altcoin list to 40 in April 2025 update, adds Dogecoin and PYTH trusts