VET and XTZ Approaches Falling Wedge Resistance – Could Breakout Spark a Recovery?

Date: Sun, March 16, 2025 | 04:40 AM GMT
The cryptocurrency market is showing signs of stabilization as Bitcoin (BTC) has bounced back from its recent dip near $76,000 and is now trading around $84,000. This positive shift is giving altcoins a much-needed boost— to tokens like Vechain (VET) and Tezos (XTZ), both of which have suffered heavily over the last 90 days.
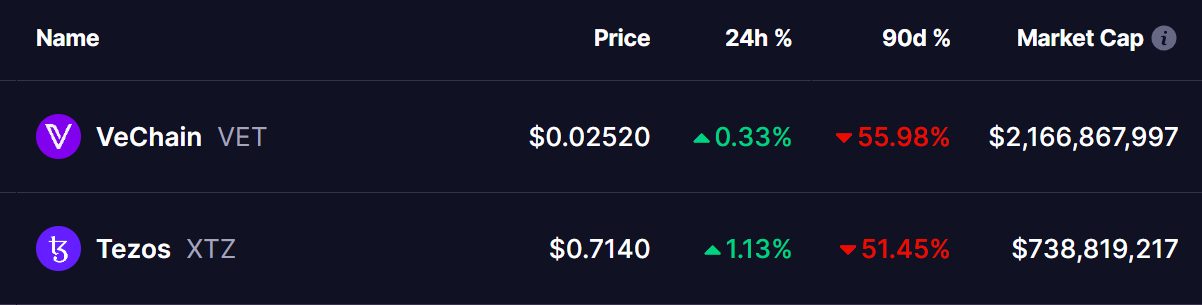 Source: Coinmarketcap
However, as the market stabilizes, both tokens are approaching key resistance levels within their respective falling wedge patterns. A potential breakout could signal the beginning of a strong recovery for both assets.
VeChain (VET) Analysis
VET’s daily chart highlights a clear falling wedge pattern that began after its rejection from the December 3 high of $0.080. Since then, the token has dropped more than 68%, hitting a low of $0.021 on March 11.
But momentum seems to be shifting. VET has climbed back to $0.025, now pressing against the upper boundary of the wedge. A breakout above this resistance—ideally confirmed with a successful retest—could open the door for a move toward $0.036, which aligns with the 50-day moving average (MA).
If the rally gains strength, VET could aim even higher—toward the $0.048 zone, near the 100-day MA. That would mark a potential 92% gain from current levels.
Tezos (XTZ) Analysis
XTZ has followed a similar trajectory. After peaking at $1.90 in early December, the token dropped over 68%, bottoming out at $0.61 on March 11.
Currently trading around $0.7145, XTZ is edging closer to breaking out of its own falling wedge pattern. A successful breakout and retest could push the price toward the $0.92 resistance level, in line with its 50-day MA.
If bullish momentum continues, the next target could be $1.13, near the 200-day MA—representing a potential 57% rally from current prices.
What’s Next for VET and XTZ?
Both tokens are now at crucial technical junctures. Falling wedge patterns are often early indicators of a reversal, but confirmation with volume and follow-through is key. Traders will be watching closely for decisive breakouts.
While technicals look promising, broader market sentiment, Ethereum’s next big move, and macroeconomic factors will still play a significant role in shaping what comes next.
Disclaimer: This article is for informational purposes only and does not constitute financial advice. Always do your own research before making any investment decisions.
Disclaimer: The content of this article solely reflects the author's opinion and does not represent the platform in any capacity. This article is not intended to serve as a reference for making investment decisions.
You may also like
Potential Dogecoin Rally Ahead as Key Support Level and Increased Buying Interest Emerge
Market Insights: Short-Term Recovery Signals for BONK, ALCH, and Bitcoin
In Brief Analyst Pseudonym identifies recovery signals in BONK, ALCH, and Bitcoin. Short-term trading strategies recommended for cautious positions. Increasing interest in meme tokens amid market volatility.

Ethereum Price Fluctuations Ignite Technical Analysis and Strategic Forecasts
In Brief Ethereum's price fluctuations shift focus to technical indicators among market players. Analysts signal potential recovery and long-term growth opportunities for Ethereum. Competition from networks like Solana raises challenges for Ethereum's market position.

Market Turmoil: Investors React as OM Coin Crashes 90%
In Brief OM Coin experiences a dramatic 90% drop, alarming the crypto market. IP Coin's price decline raises investor concerns about potential panic sales. Support levels for IP Coin are being closely monitored following recent fluctuations.