
- XRP dropped 5% in the past 24 hours, unable to reclaim the 20-day EMA.
- Volatility Shares filed for three XRP exchange-traded funds (ETFs).
- The SEC recently acknowledged 19b-4 filings from Grayscale for a spot XRP ETF.
Asset manager Volatility Shares has filed for three XRP exchange-traded funds (ETFs): XRP ETF, 2x XRP ETF, and -1x XRP ETF, showing a growing surge of institutional interest in the XRP token.
This filing follows Volatility Shares’ recent applications for two Solana futures ETFs—SOLZ and SOLT—which appeared on the Depository Trust and Clearing Corporation (DTCC) list in late February.
XRP Price Prediction: Will ETFs Unleash a Bull Run?
The filing of these ETFs could mark a turning point for XRP, particularly as Polymarket data suggests a 76% probability of a spot XRP ETF approval by 2025.
Still, expectations for approval before July 31st remain low at 32%, showing the SEC’s historically cautious approach toward crypto ETFs.
Related: XRP Price Prediction March 8: Bulls vs. Bears at $2.60 & $2.40 — Trader’s Guide
XRP Price Analysis: SEC’s ETF Nod–What It Signals
Interestingly, the SEC has acknowledged a 19b-4 filing by the New York Stock Exchange (NYSE) and asset manager Grayscale regarding an XRP ETF, marking the first time it has officially responded to such a proposal. This sets a 240-day countdown for the Commission to decide on the matter.
While the SEC has also acknowledged applications for Solana (SOL), Litecoin (LTC), and Dogecoin (DOGE) ETFs, the XRP case stands out because of the ongoing lawsuit against Ripple, the token’s issuer. The regulator’s coming decision could set the standard for how it treats other altcoins in the ETF market – and their potential prices.
XRP Price Watch: Teetering at $2.36–Forecast Bearish or Bullish?
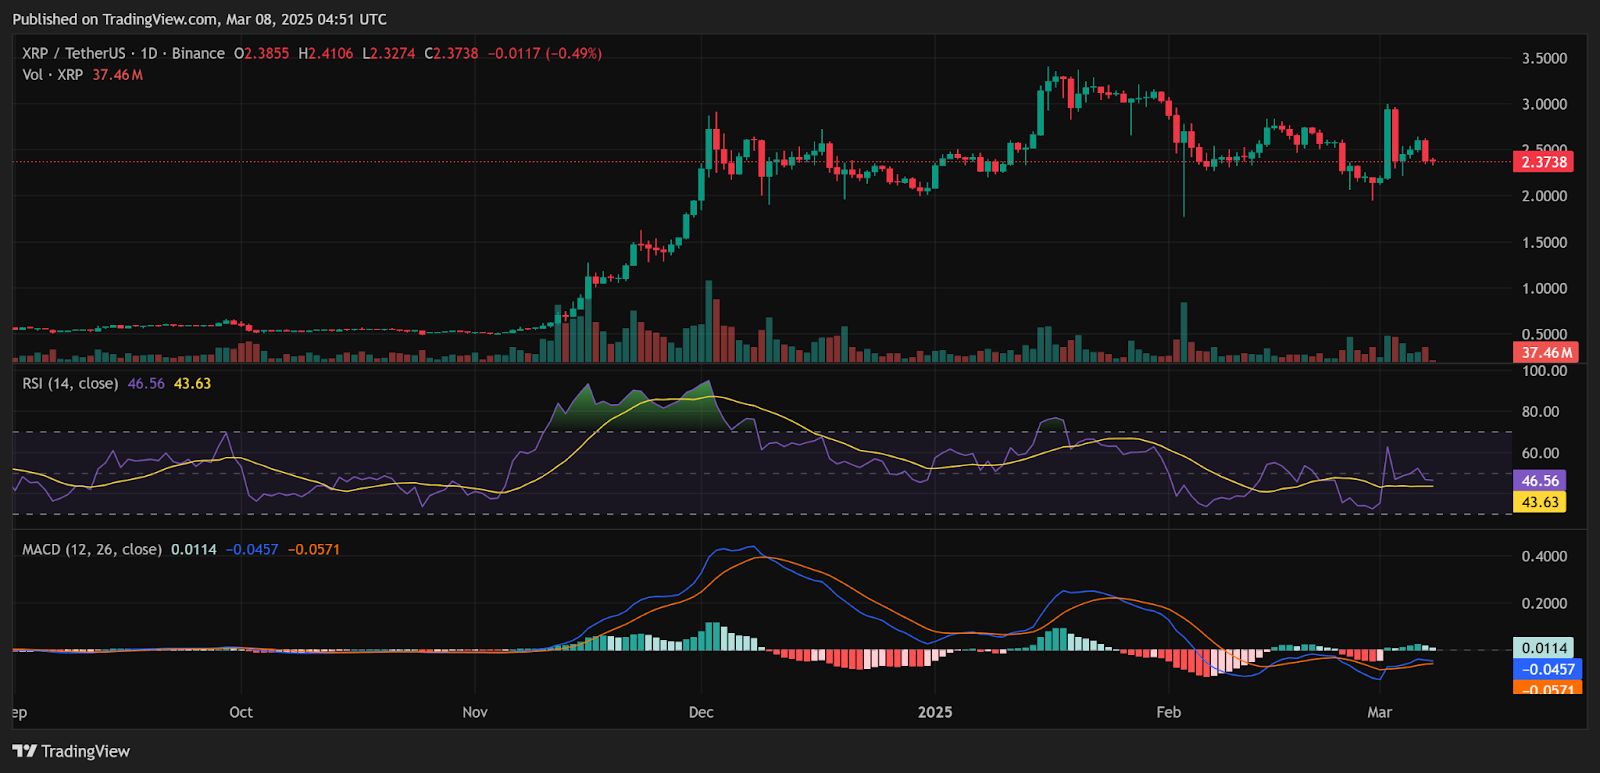
At the time of writing, XRP trades at $2.36, down 5% in the past 24 hours. The 20-day exponential moving average (EMA) at $2.44 is acting as immediate resistance, with price struggling to get above this level.
The daily chart below shows that the Relative Strength Index (RSI) stands at 46.56, suggesting neutral momentum, sitting just below the 50 level. A move above 50 could indicate renewed bullish strength, while further declines could confirm bearish control.
XRP Price Target: $3.00 or Lower? – Key Levels to Watch
On the other hand, the XRP price action is approaching the lower Bollinger Band, showing oversold conditions. This suggests that a bounce is possible if buying pressure emerges, but a breakdown could trigger further losses.
Related: XRP Bull Run Ignition? Analyst Predicts Major Price Surge, Cites Key XRP Patterns
XRP must reclaim $2.44 (20-day EMA) and $2.50 psychological resistance to regain bullish momentum. If the price fails to hold the $2.30 support, further downside toward $2.00 could be likely. Conversely, a break above $2.50 could open the door to a retest of $3.00 in the near term.
Disclaimer: The information presented in this article is for informational and educational purposes only. The article does not constitute financial advice or advice of any kind. Coin Edition is not responsible for any losses incurred as a result of the utilization of content, products, or services mentioned. Readers are advised to exercise caution before taking any action related to the company.