Onyxcoin (XCN) Prepares for a Potential Rebound After 50% Correction

Onyxcoin’s recent rally has slowed, with technical indicators showing uncertainty. Whether XCN moves higher or lower depends on market momentum.
Onyxcoin (XCN) lost over 50% in February after a massive rally of nearly 2,000% between January 13 and January 26. Despite the ongoing decline, its recent indicators show mixed signals. RSI has stayed neutral for the past nine days, and ADX is pointing to a weakening downtrend.
XCN is currently trading between resistance at $0.017 and support at $0.0143, with EMA lines still reflecting a bearish trend. Whether the price moves higher or lower will depend on whether momentum returns or if selling pressure continues to push XCN toward lower support levels.
XCN RSI Has Been Neutral For 9 Days
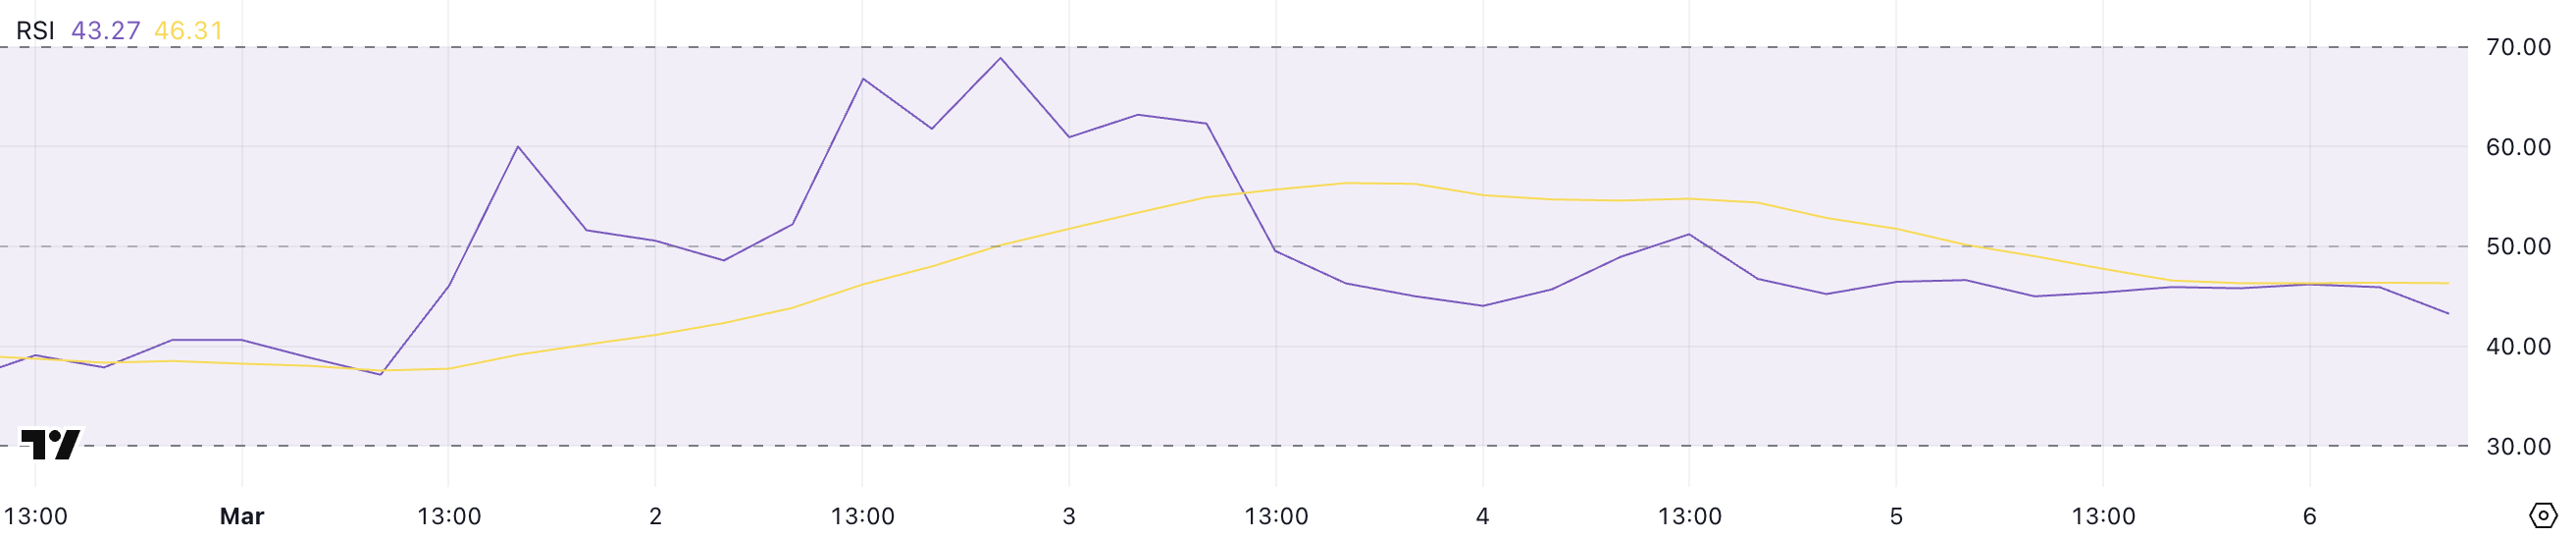
Onyxcoin has an RSI of 43.2, down from its recent high of 68.9 on March 2.
Since yesterday, it has been fluctuating between 45 and 46, maintaining a neutral position without clear upward or downward momentum.
RSI, or the Relative Strength Index, is a momentum indicator that measures the speed and magnitude of price movements on a scale from 0 to 100.
 XCN RSI. Source:
TradingView.
XCN RSI. Source:
TradingView.
Readings above 70 indicate overbought conditions, suggesting a potential pullback, while readings below 30 signal oversold conditions, which could precede a rebound.
With XCN’s RSI at 43.2, the asset remains in neutral territory, where it has been since February 25.
A move above 50 could indicate growing bullish momentum, while a drop toward 30 may signal increasing selling pressure.
Onyxcoin ADX Shows the Downtrend Is Losing Steam
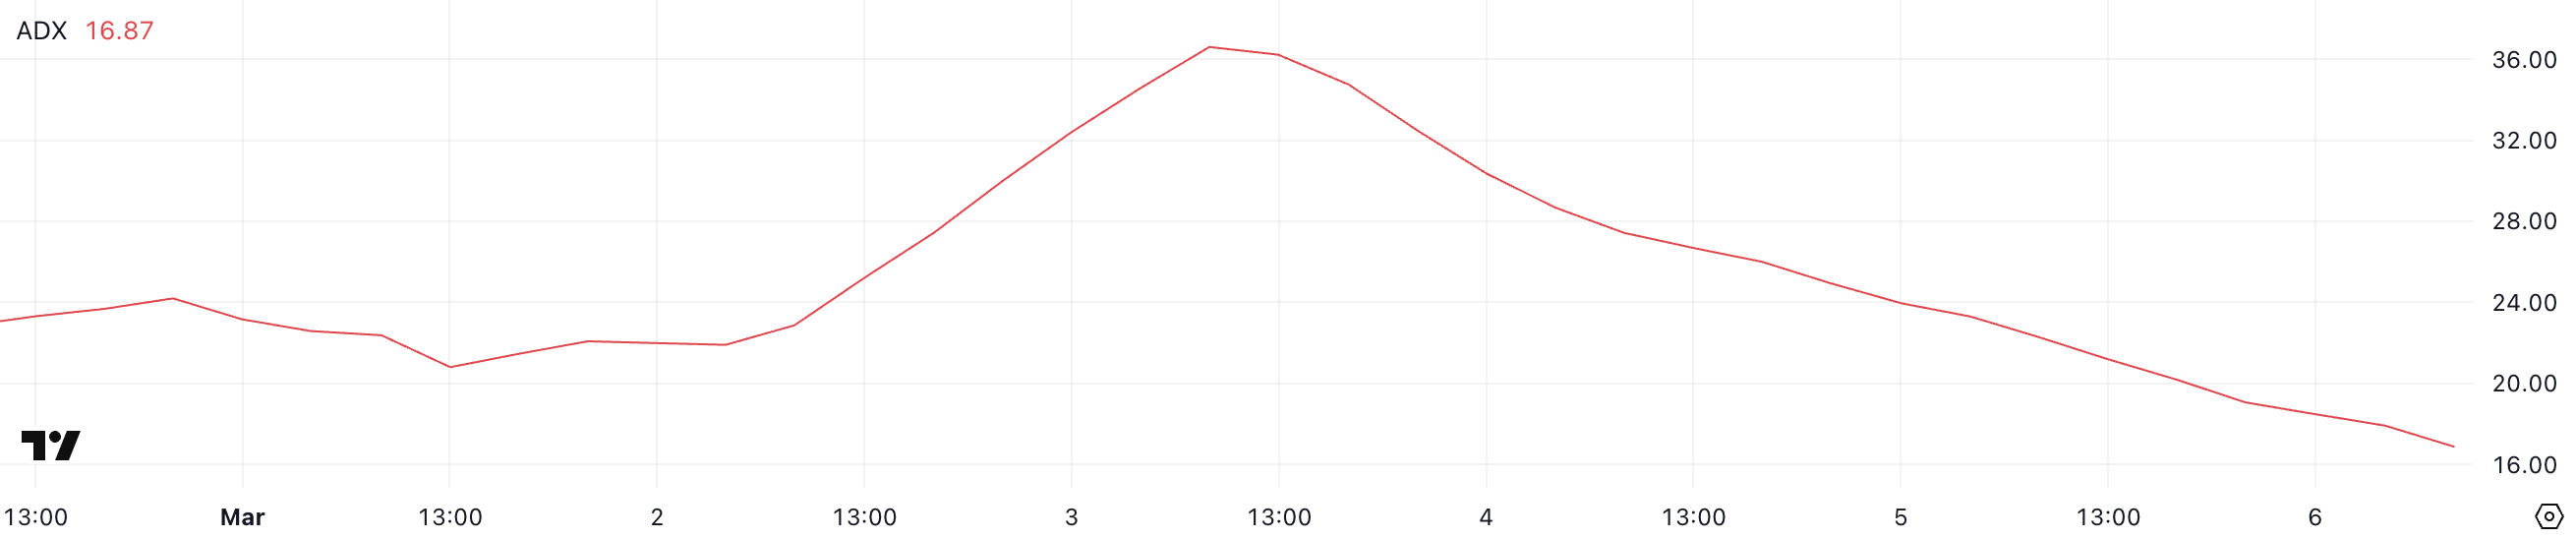
XCN’s ADX is 16.8, down from 36.6 three days ago, indicating a steady decline in trend strength. This drop suggests weakening momentum, aligning with XCN’s recent downtrend over the past few days.
The Average Directional Index (ADX) measures the strength of a trend on a scale from 0 to 100.
 XCN ADX. Source:
TradingView.
XCN ADX. Source:
TradingView.
Readings above 25 typically indicate a strong trend, while values below 20 suggest weak or nonexistent trend momentum. With XCN’s ADX at 16.8, the current downtrend lacks strong conviction, meaning further downside may be limited unless momentum picks up again.
If ADX continues to decline, XCN could move into a consolidation phase rather than a sustained downward move.
Onyxcoin Could Fall Below $0.014 Soon
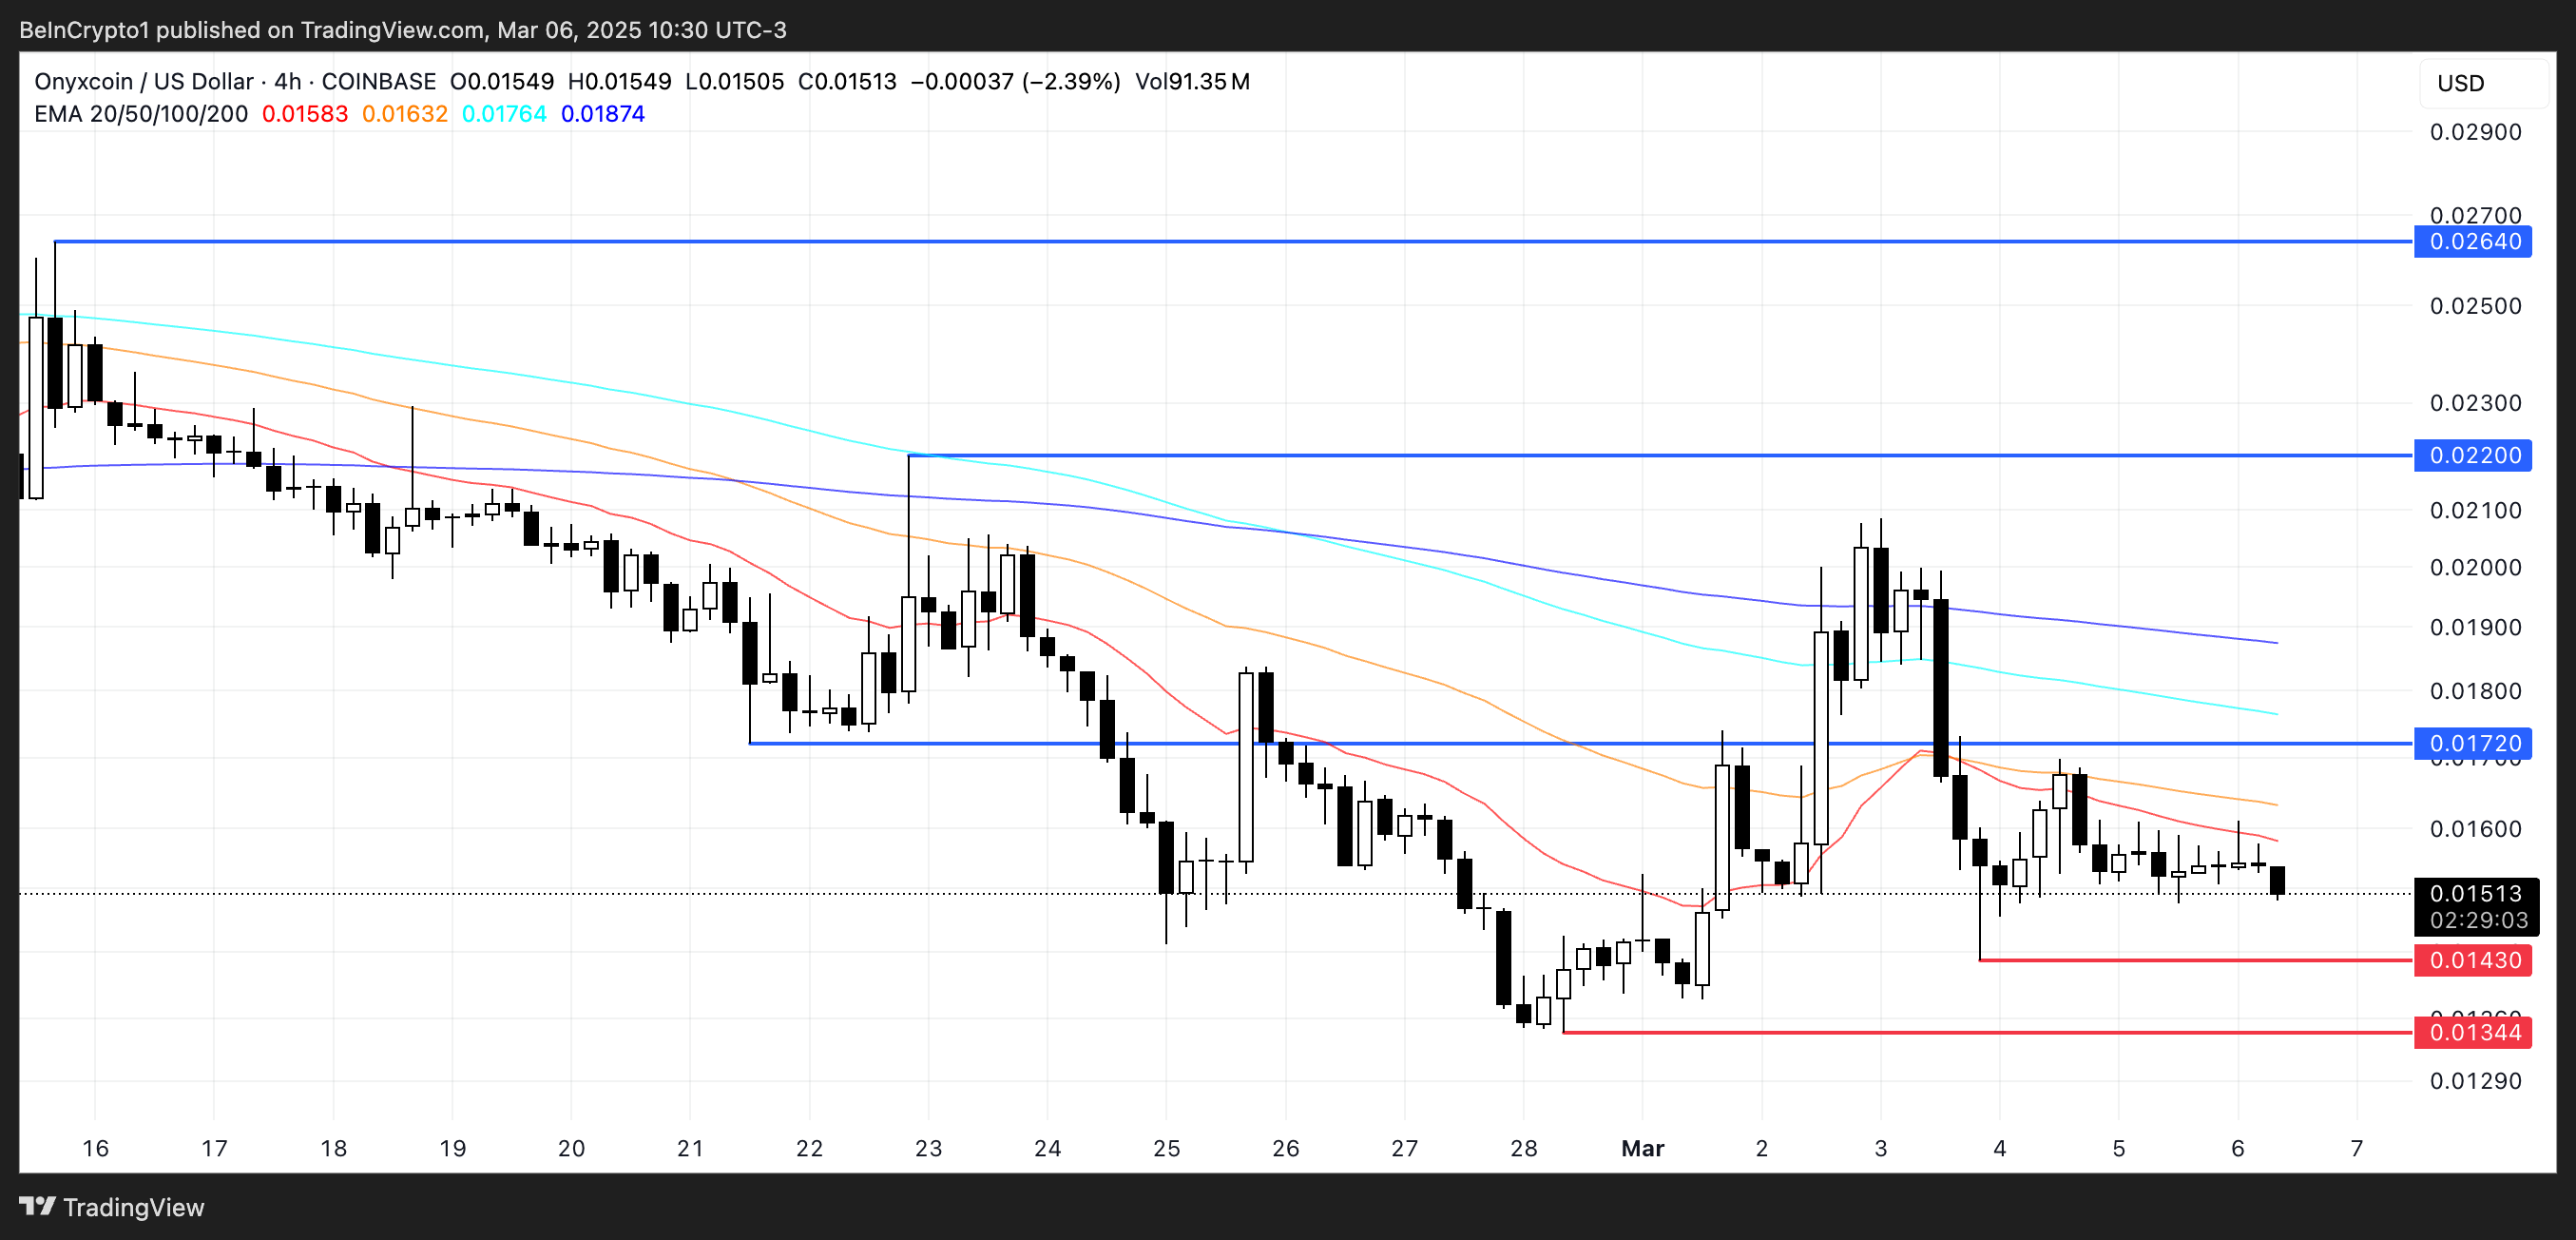
After a historical surge in January, when XCN was one of the best-performing altcoins in the market, Onyxcoin’s price is now trading between resistance at $0.017 and support at $0.0143. Its EMA lines show a bearish trend as short-term EMAs remain below long-term ones.
If the ongoing downtrend continues, XCN could test the $0.0143 support level, and a break below that could push the price further down to $0.0134.
 XCN Price Analysis. Source:
TradingView.
XCN Price Analysis. Source:
TradingView.
However, ADX indicates that the downtrend is weakening, which could open the door for a reversal.
If buying momentum returns, Onyxcoin could test resistance at $0.017, and a breakout above that level could send the price toward $0.022. A stronger recovery, similar to its momentum in January, could push XCN as high as $0.0264.
Disclaimer: The content of this article solely reflects the author's opinion and does not represent the platform in any capacity. This article is not intended to serve as a reference for making investment decisions.
You may also like
The address with the largest loss on Cocoro sold out 2 hours ago, losing $317,000
Web3 data and AI company Validation Cloud completes $15 million Series A funding
BRICS News: Russia Launches Gold Digital Asset Pilot—A Shift in Global Payments?

XRP News: XRPL Enhances Onchain Finance with Permissioned Domains
