- Due to increased adoption and the ongoing development of the Neo blockchain, GAS could surpass its previous highs by 2029.
- Driven by network advancements and market optimism, projections suggest that GAS might even reach $8.00 by 2030.
- With widespread integration, the token could hit $12.00 by 2040, depending on favorable regulatory conditions and technology developments.
Gas (GAS) remains a focal point in the crypto world, capturing attention due to its role in the Neo ecosystem. Its development and strategic updates have positioned GAS as a valuable asset despite experiencing some market fluctuations. These changes have caused price volatility, leaving investors speculating its future trajectory. Despite recent struggles, GAS maintains a strong presence on CoinMarketCap, with a significant market cap, reflecting its resilience and potential.
As the technology behind Neo continues to evolve, the future of GAS could hang in the balance. Can it maintain its growth trajectory and carve out a significant role in the market? Read on for our GAS price prediction as we explore the potential trends from 2024 to 2030.
Table of contents
- GAS (GAS) Current Market Status
- What is GAS (GAS)?
- GAS (GAS) Price Prediction 2024-2030 Overview
- GAS (GAS) Price Prediction/Analysis
- GAS (GAS) Price Prediction: Short-Term Analysis
- GAS (GAS) Price Prediction: Gas Faces Resistance
- GAS (GAS) Price Prediction: Moving Averages
- GAS (GAS) Price Prediction 2025
- GAS (GAS) Price Prediction 2026
- GAS (GAS) Price Prediction 2027
- GAS (GAS) Price Prediction 2028
- GAS (GAS) Price Prediction 2029
- GAS (GAS) Price Prediction 2030
- FAQs
GAS (GAS) Current Market Status
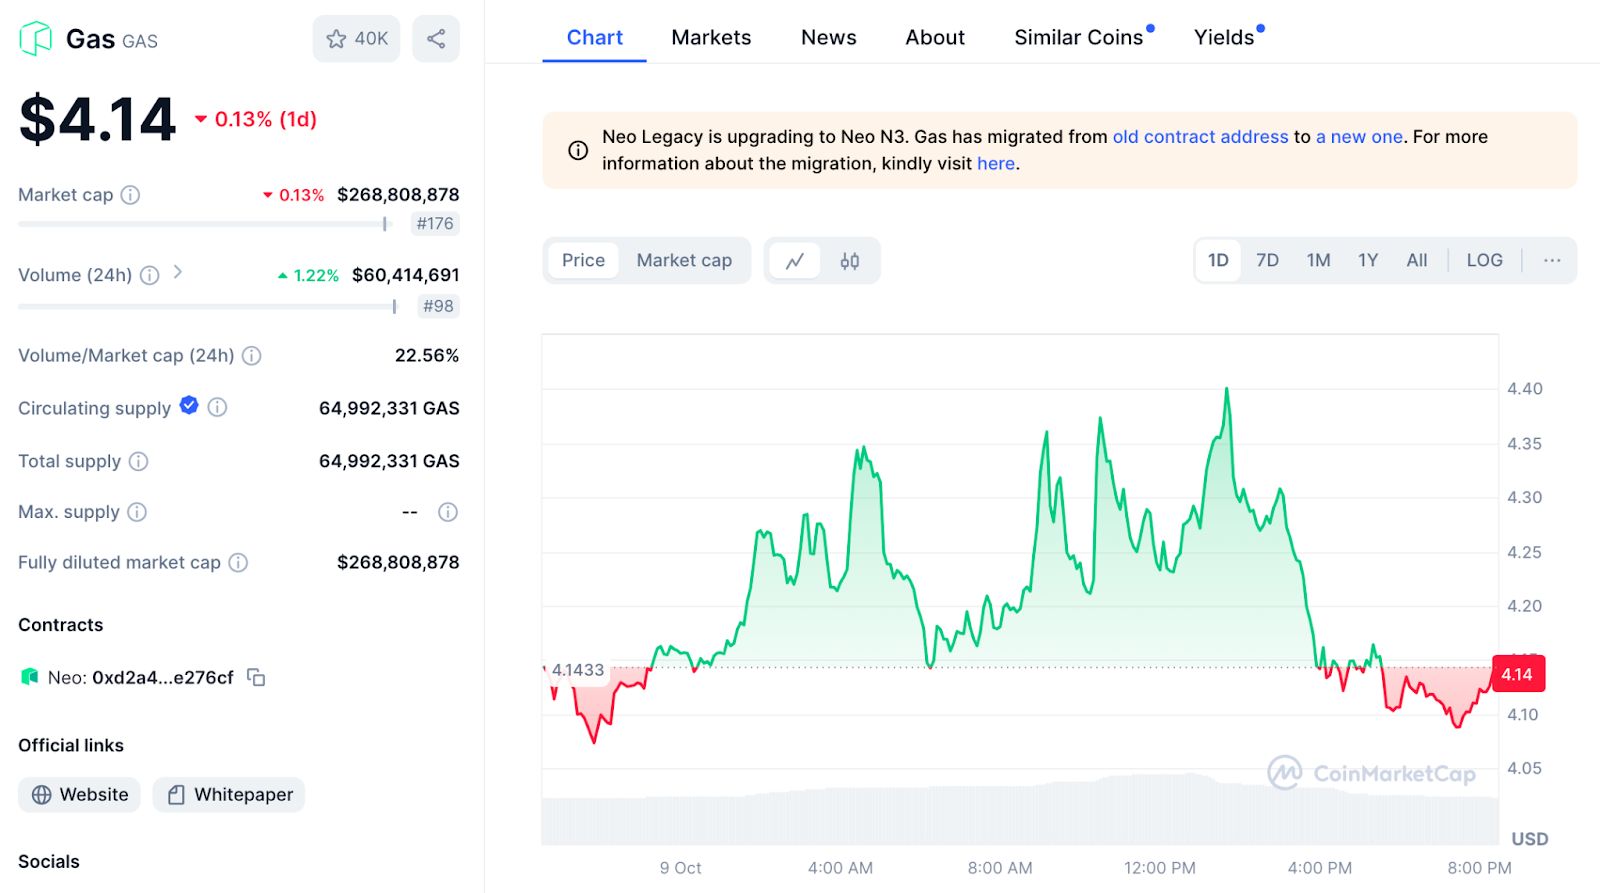
At the time of writing, GAS is trading at $4.14, placing it at #176 in the cryptocurrency rankings by market capitalization. The current market cap sits at approximately $268.81 million, based on a circulating supply of 64,992,331 GAS tokens. The 24-hour trading volume reached $60.41 million, indicating ongoing interest and trading activity.
What is GAS (GAS)?
Gas (GAS) fuels the Neo blockchain, which is utilized to pay for network transactions and smart contract executions. It plays a crucial role in the Neo ecosystem by supporting dApp development and ensuring the network’s overall functionality. As part of Neo’s dual-token system, GAS is significant for its utility in enabling decentralized applications and innovative contract operations.
 Snap | Source: CoinMarketCap
In recent months, GAS has experienced a moderate rally, with its price fluctuating between $4.00 and $4.40. The 24-hour chart shows an overall downward movement of 0.13%, although the trading volume increased by 1.22%. The market sentiment reflects mixed feelings, with periods of both buying and selling pressures.
GAS (GAS) Price Prediction 2024-2030 Overview
| Year | Potential Low ($) | Potential High ($) |
| 2024 | $4.50 | $5.50 |
| 2025 | $5.00 | $6.50 |
| 2026 | $6.00 | $7.50 |
| 2027 | $6.50 | $8.00 |
| 2028 | $7.00 | $8.50 |
| 2029 | $7.50 | $9.00 |
| 2030 | $8.00 | $10.00 |
GAS (GAS) Price Prediction/Analysis
The recent price movements have sparked curiosity among traders and investors. Despite the fluctuations, there is optimism about potential rebounds and further growth. Below is our analysis of GAS’s potential price trajectory over the next several years.
GAS (GAS) Price Prediction: Short-Term Analysis
Analyzing the short-term price trends, GAS exhibits a consolidation phase, fluctuating around the $4.00 support level. If the price stays above this support, it could see a rebound towards the $4.40-$4.50 range. However, further declines are likely if the price drops below $4.00.
The upward potential appears firmer if trading volumes remain high, suggesting that increased investor interest may support a rally toward the $5.00 level in 2024.
GAS (GAS) Price Prediction: Gas Faces Resistance
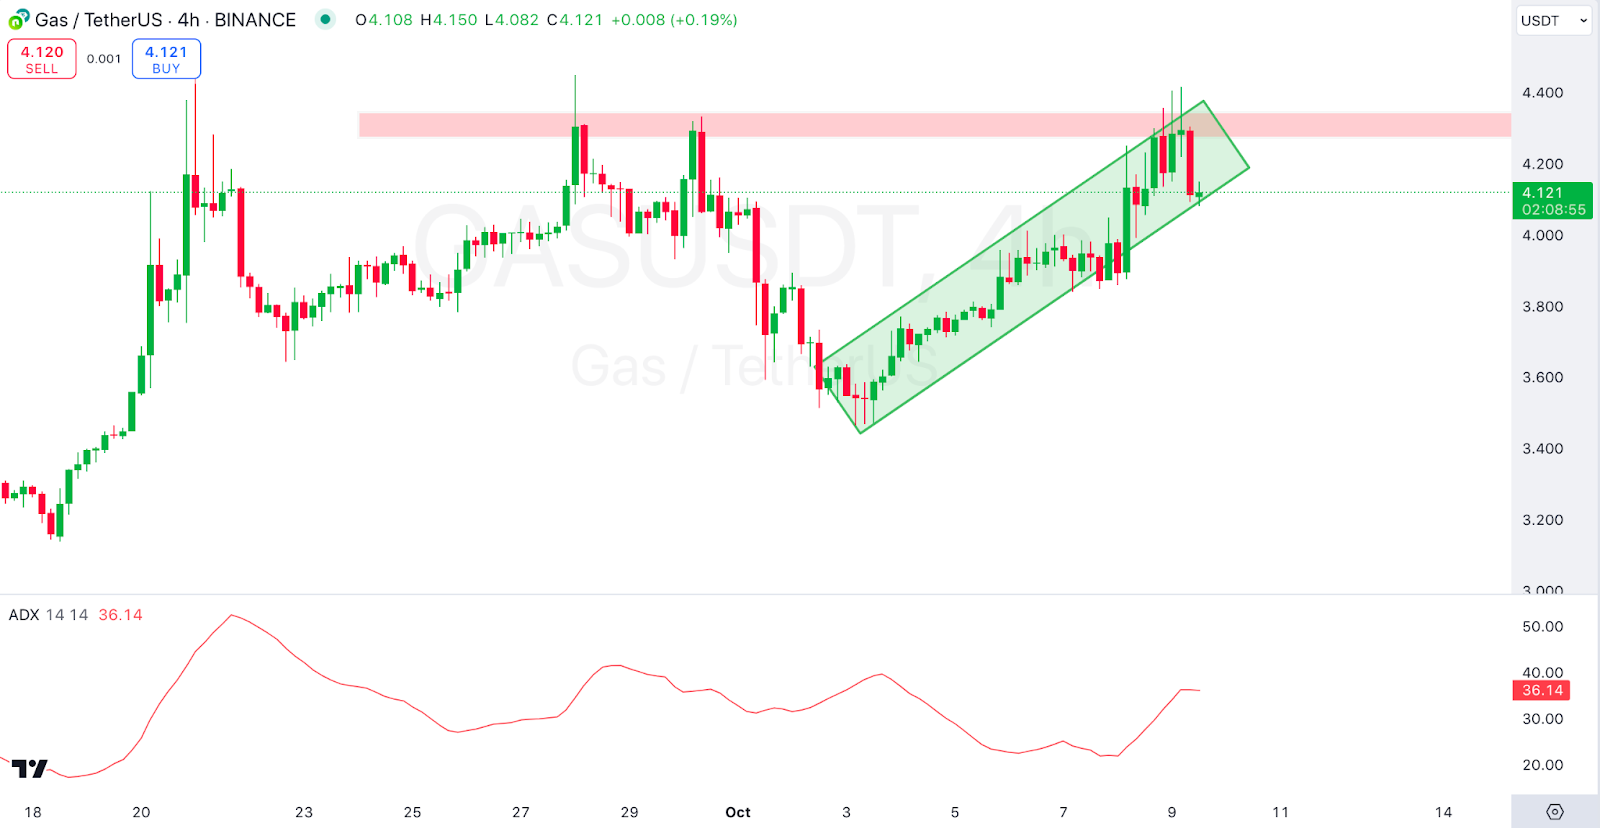
An in-depth analysis shows that Gas charts show a notable upward trend within a defined ascending channel, signaling a bullish sentiment in recent trading sessions. The price action for GAS has formed an ascending channel characterized by higher lows and higher highs. This pattern is typically bullish and suggests that as long as the price remains within the channel, we can expect an uptrend to continue. The recent candlesticks cluster near the channel’s upper boundary, indicating robust buying interest at higher prices.
 4-hour GAS/USDT Chart | Source: TradingView
A visible resistance zone has formed between $4.20 and $4.40, where previous peaks have formed. This zone acts as a barrier, and the price might face selling pressure, potentially leading to a pullback or consolidation within the channel. On the other hand, we see that the ADX line is at 36.14, which points to a strong trend. Generally, an ADX value above 25 suggests the current trend is strong and likely to continue. The rising ADX value aligns with the visible uptrend, reinforcing the strength of the current bullish movement.
The GAS/USDT pair exhibits a strong bullish trend on the 4-hour chart within an ascending channel. Traders should focus on the upper resistance zone and the channel boundaries for potential trading signals, keeping an eye on the ADX for indications of any changes in trend strength. Maintaining a disciplined approach with proper risk management and stop-loss strategies is crucial.
GAS (GAS) Price Prediction: Moving Averages
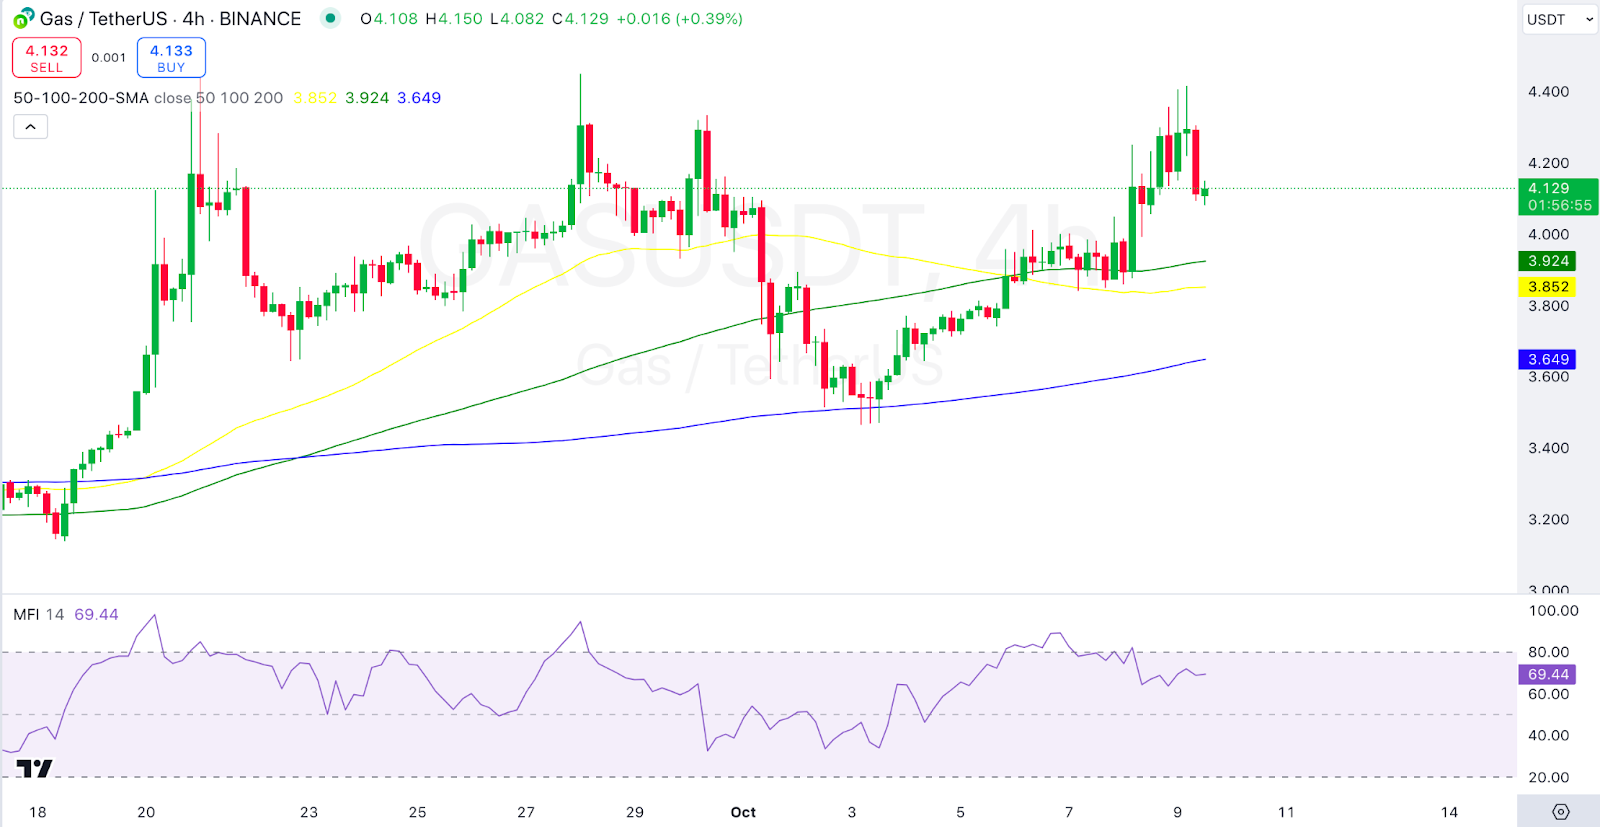
On the other hand, the 50-period simple moving average (SMA) acts as a dynamic support level in the current chart. The price has remained above this moving average for the most part, indicating a bullish trend in the mid-term. Like the 50-SMA, the 100-period SMA has also served as a support level. The price action above this line further reinforces the bullish sentiment in the market. The 200-period SMA is well below the current price, confirming the bullish long-term trend. The significant distance between the price and this moving average suggests strong buyer control in the market.
Looking at other indicators, we see that the MFI is currently at 69.44, which is near the overbought territory (above 70). This indicator suggests that there has been significant buying pressure but also signals caution as the market might be approaching overbought conditions, which could lead to a potential pullback or consolidation. The price action shows a consolidation phase followed by a breakout above the psychological level of $4.00. This breakout is supported by increased volume (not shown), adding credibility to the upward move.
 4-hour GAS/USDT Chart | Source: TradingView
The position of the price relative to the moving averages and the MFI’s current reading reflect positive sentiment but warrant caution due to the proximity to overbought conditions. Traders might consider entering a position if the price pulls back slightly due to the high MFI reading, ideally near the 50-SMA or 100-SMA, which could provide better risk-reward opportunities.
GAS (GAS) Price Prediction 2025
By 2025, the Neo platform’s broader acceptance and blockchain technology improvements could push GAS prices toward the $6.50 mark. The anticipated growth in the ecosystem is expected to drive higher usage, contributing to price appreciation.
GAS (GAS) Price Prediction 2026
In 2026, continued growth in decentralized finance (DeFi) and smart contract activities could support GAS prices within the $6.00-$7.50 range, with an average price of $6.75.
GAS (GAS) Price Prediction 2027
A major rally might occur by 2027, pushing GAS above $8.00 as the network expands further. Increased utility and higher transaction volumes will likely drive demand for GAS tokens.
GAS (GAS) Price Prediction 2028
As adoption broadens, GAS prices could continue climbing, potentially reaching $8.50 in 2028. The ecosystem’s maturity and growing use cases will be key factors in sustaining this growth.
GAS (GAS) Price Prediction 2029
In 2029, GAS may experience a consolidation phase with a predicted range of $7.50 to $9.00. Continued market acceptance and partnerships will likely sustain investor interest.
GAS (GAS) Price Prediction 2030
By 2030, GAS is expected to hit a new high, potentially reaching $10.00. This growth is attributed to the Neo network’s ongoing evolution, wider adoption, and its established market position.
FAQs
Gas (GAS) is the utility token of the Neo blockchain, used for transaction fees and network operations. It supports the Neo ecosystem, focusing on digital assets, smart contracts, and decentralized applications.
GAS is currently trading at $4.14, with a market cap of $268.81 million and a circulating supply of 64,992,331 GAS.
Factors like network adoption, regulatory developments, ecosystem partnerships, and general market trends will play a significant role.
Disclaimer: The information presented in this article is for informational and educational purposes only. The article does not constitute financial advice or advice of any kind. Coin Edition is not responsible for any losses incurred as a result of the utilization of content, products, or services mentioned. Readers are advised to exercise caution before taking any action related to the company.


