Crypto Trading 101: Bull and Bear Flag Patterns
INTRODUCTION
Bull and bear flags are types of chart patterns used by technical analysis (TA) traders. They are used by these traders to try to forecast future price changes. Flag patterns signify continuation within a long term price trend, and can be used by traders to help them understand what might happen next to an asset’s price.
This article will take a look at the different types of flag patterns in technical analysis, and how technical traders use these patterns to try to forecast future price movements before they occur.
SUMMARY
- Bull and bear flags are commonly used by technical analysis traders to predict changes in the direction/momentum of a market.
- Both are shaped like flags on a chart and can be identified by a rapid up/down movement in price, a period of consolidation, followed by a breakout in the bullish/bearish direction respectively.
- They're used to inform both entries and exists for traders can play out over lower or higher timeframes.
- While they aren't guaranteed to take place each time there's a rapid up/down movement followed by consolidation, they may help inform a trader's decision making alongside other methods like on-chain analysis.
CHART PATTERNS IN CRYPTO
Chart patterns are some of the most frequently used tools by technical traders to predict changes in direction and momentum of asset prices. In crypto, technical analysis is a popular subset of trading methodology , and a large number of traders often resort to it in order to identify entries and exits for their trades.
Chart patterns constitute a subset of technical analysis, in that traders can use patterns alongside horizontal levels of support or resistance to try to predict likely future price movements and potential inflection points. Traders can also use these patterns alongside indicators, which might help them identify further variations or incoming movements in the price of an asset.
The theory behind analyzing chart patterns and technical analysis in general is that psychological impulses and similar human instincts when trading result in various common reactions to specific price movements, which express themselves as consistent chart patterns. Some of these chart patterns, such as the head and shoulders pattern, are very well known. The validity of this theory and usefulness of technical analysis is hotly disputed in trading circles, both in crypto and in traditional finance. For this purposes of this article we’ll be explaining how flag patterns, a type of chart pattern, are understood and used in technical analysis circles.
‘Flag’ patterns are taken to signal potential breakouts either to the upside (bull flag) or downside (bear flag). Flags form when bullish or bearish momentum is stalled - and indicate the return of this momentum as the flag pattern plays out. It’s called a flag because it literally looks like a flag on the price chart.
WHAT IS A BULL FLAG?
A ‘bull flag’ is a type of chart pattern that is taken to indicate bullish momentum or the continuation of positive price movement. Traders identify bull flags by identifying the shapes and trends formed by a chart as a result of price action.
Here’s an example of a multi-day bull flag on Tesla in late 2020, when the market was beginning to heavily allocate towards high-growth stocks and the tech sector.
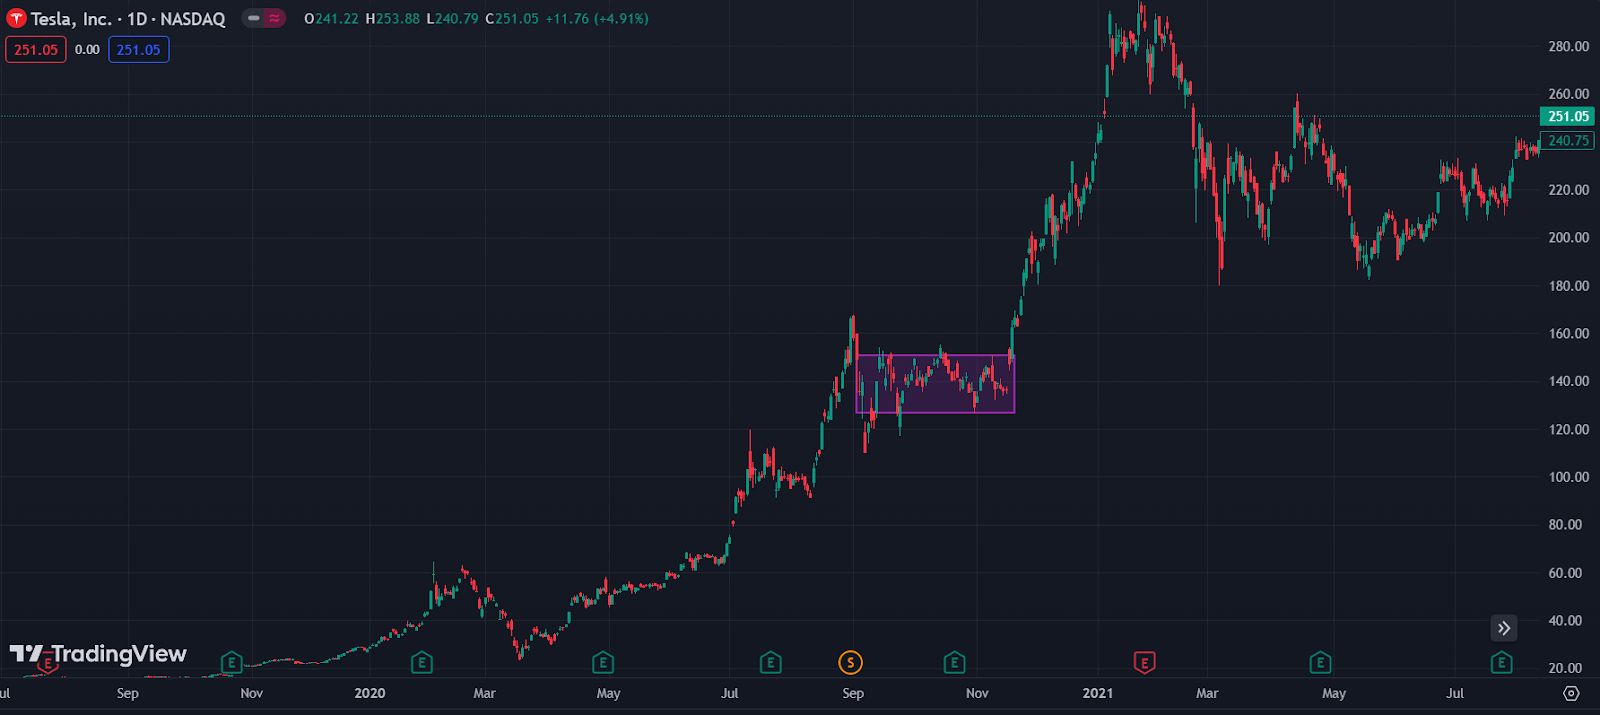
A bull flag is formed by a rapid upwards price movement (the ‘flagpole’), followed by a period of consolidation (the ‘flag’), during which price ranges up and down without a significant move in either direction. Usually, the flagpole is accompanied by a rapid increase in trading volume - the asset may break other resistances as well, displaying significant bullish momentum - essentially, a fast upward price movement. The flag occurs afterwards, and is marked by the asset’s price ranging within either a horizontal rectangle shape, or two parallel, downward-facing lines. It could also be accompanied by a steady decline in price over that period, though this is not necessarily the case.
A bull flag pattern ends when the asset’s price breaks out of the range marked by the flag, to the upside, or downside. An upside breakout is a validation of the pattern, and traders will often take this to imply a strong likelihood of continuation to the upside. On the other hand, a downside breakout will imply a failure of the pattern - meaning, it wasn’t necessarily a ‘bull’ flag in hindsight.
WHAT DOES A BULL FLAG LOOK LIKE?
A bull flag is formed of 2 parts. The first part is the flagpole. In a bull flag, this occurs before the flag portion of the chart pattern, and can be recognised by a price surge that eventually meets some resistance at the end of the move. On a chart, this will appear as either one or a few long green candles, with preferably high volume to indicate a significant increase in buy pressure.
The second part (the flag) is formed as part of a downward or horizontal range that occurs as price consolidates below the highest part of the flag. The shape of this range determines the type of chart pattern that forms after the flagpole - for a bull flag to form, the range must be contained within two parallel lines on the chart. If the range appears to close towards a single point instead, the chart will be forming a pennant rather than a flag pattern.
A bull flag ends with the break of this flag’s range. Technical traders often take an upwards breakout from this range to be a sign of bullish continuation, and will often take out long positions on a range-break in order to capitalize on this momentum.
WHAT IS A BEAR FLAG
There are two types of flag patterns: a bull flag and a bear flag. So what’s the difference?
Whereas a bull flag is supposed to indicate upwards (bullish) momentum for a particular asset’s price, a bear flag is supposed to indicate downwards (bearish) momentum. A bear flag is an inverted version of the bull flag described above.
This means that it starts with an impulse of downwards momentum, followed by a consolidation period where the price slowly ranges upwards between two parallel upwards-facing diagonal lines. Traders would look for this period of consolidation and attempt to identify a point of breakout - where they could take out a bearish bet or short position.
Like the bull flag, this chart pattern displays a pattern of momentum upon its confirmation, and traders would seek to capitalize on the continuation by taking out short positions, or similar bearish bets.
WHAT DOES A BEAR FLAG LOOK LIKE?
A bear flag, like a bull flag, has two components. It begins with a flagpole - in the case of the bear flag, this is a large drop in price, not a gain. The flagpole may be identified by support breaks or other significant bearish indicators such as the setting of new yearly or all time lows. However, it does not necessarily need to break any significant support lines. If the market structure is bearish, it is more likely that a downward trend sees continuation - meaning that a bear flag is more likely to form.
Once a bear flag chart pattern has begun, the portion representing the flag marks a period of cooling off, or consolidation from the initial downwards move. This is a consolidation upwards in price rather than downwards. Similar to the bull flag however, the bear flag is still marked by two parallel diagonal lines that form a range (this time facing upwards), and the flag pattern is either confirmed or invalidated by the breakout from that range. A bearish breakdown would imply confirmation of the bear flag pattern, while an upwards breakout would invalidate the pattern.
TRADING A BULL FLAG
Bull flag patterns are typically used by traders to provide informed exits and entries for future potential long positions or bullish bets, and certain traders choose to systematically approach every bull flag in exactly the same way. Other traders may choose to adopt slight variations in their approaches depending upon e.g. the relative volume between the flagpole and the flag, or the depth of the flag, which may indicate different degrees of bullish momentum.
A bull flag pattern can show a number of different pieces of information to a trader before they decide to execute on a certain trade. For example - a bull flag may vary in terms of its flagpole length, the distance between the parallel lines delineating the flag, and the length/depth of consolidation during the flag phase.
These factors will all affect the type of trade that a trader may choose to take upon confirmation of the bull flag pattern. A deeper consolidation period, for instance, may result in the trader lengthening the distance between their entry and their take-profit marks. Likewise, the breakdown of a bull flag pattern may result in the trader not choosing to take any trade at all.
A typical bull flag plays out like this: a flagpole can be identified by 1-2 large green candles, accompanied by a notable increase in volume to indicate a significant amount of buy pressure that has just entered the market. Ideally, the volume lessens as the price enters the consolidation stage of the flag, and the price trades within a horizontal box or downwards-diagonal parallelogram (a shape enclosed by two parallel downwards diagonal lines). Afterwards, the price leaves the box, in the direction that the trader anticipated. The price leaving the box then provides the trader with a trigger to enter a trade, and capitalize on the continuation of momentum.
Let’s divide up the different stages of a bull flag, and identify what a trader using this chart pattern might be doing at each different stage.
INITIAL FLAGPOLE
This is the point at which the trader begins to consider the formation of a bull flag. Often, traders set alerts or have some other method of monitoring multiple different assets to notify them that a chart pattern might be forming. Once a trader has a sufficient signal of momentum, they can begin to watch the chart. (Note: a momentum signal may be different for different traders - for instance, it may be a certain % gain in a single candle, or a certain % gain within a set timeframe).
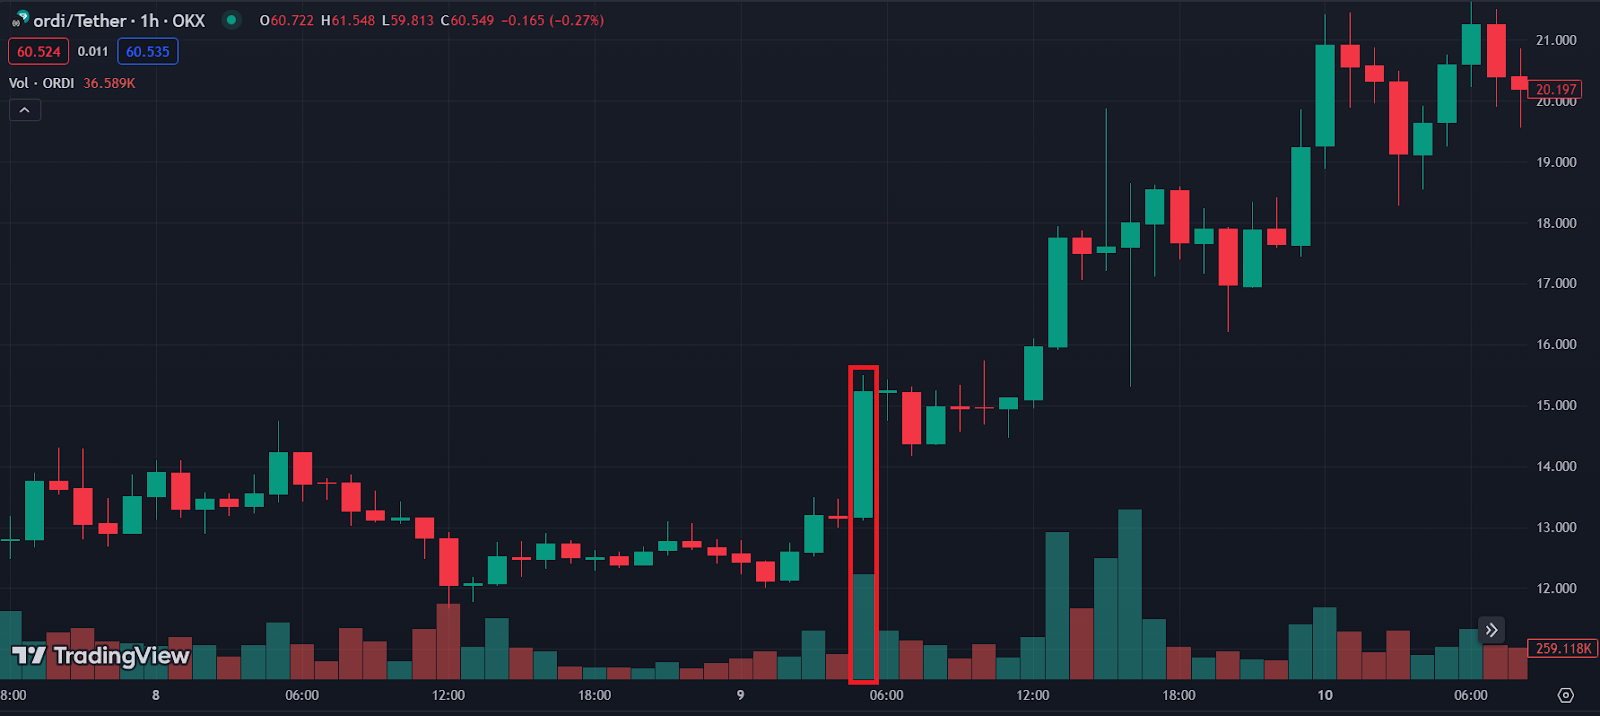
Traders often consider volume and moving average when considering the validity of the initial flagpole. An ideal flagpole would represent a significant new amount of liquidity entering the market in the form of buy pressure. Traders may then consider how volatile the asset normally is - momentum signals on a more-volatile asset could represent a less notable signal than momentum signals on a less-volatile asset. If the asset is normally not very volatile, then a +5% move in an hour is generally more noteworthy than a +5% move in an hour on a very volatile asset.
Additionally, if the flagpole represents significant upward momentum without an equally notable increase in volume, then the trader may need to carefully watch the chart for signs of future weakness. It does not necessarily invalidate the chart pattern, but a lack of significant volume off the back of an upwards move may signal an attempt at distribution rather than new liquidity and buyers arriving to an asset.
FLAG
The flag provides a number of pieces of information to the trader, along with multiple potential signals for trade invalidation. The flag begins when the price retraces from the high initially set by the flagpole.
Depending on the timeframe that a trader is watching, the flag may be as short as 2-3 candles, or lengthen to more than 10. A trader who is watching a shorter timeframe may wish to invalidate a setup if a flag extends to more than a few candles, while traders watching higher time frames may find that flag setups take longer to play out.
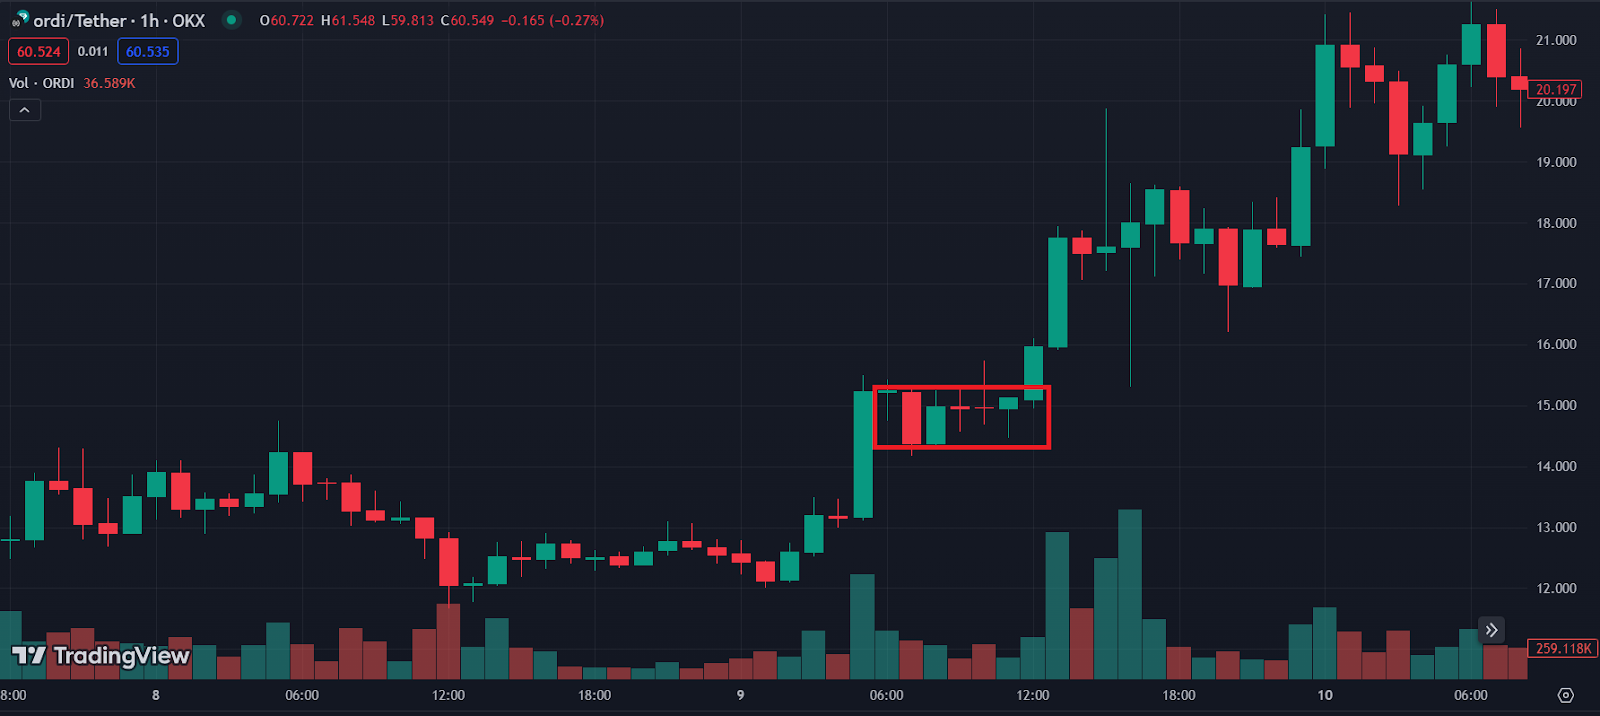
Flags can either be contained within a horizontal (flat) rectangle, or a slightly descending parallelogram, enclosed by two downwards-facing diagonal lines. Traders usually treat some descent in price as normal during the flag section, but will always consider factors such as the depth of the retrace, and the relative volume during the flag phase.
A deep retrace during the flag (especially on the initial candle after the flagpole) may signal a lack of bullish momentum - that buyers after the initial candle are less willing to step in and provide price support. When this occurs, traders may have an invalidation set at a certain % retrace, such as 50%, or some other metric. An invalidation point is individual to each trader, and will often be refined by experience - yet regardless of specific invalidation points, traders typically consider the retrace depth as a data point when choosing to execute a trade on a bull flag.
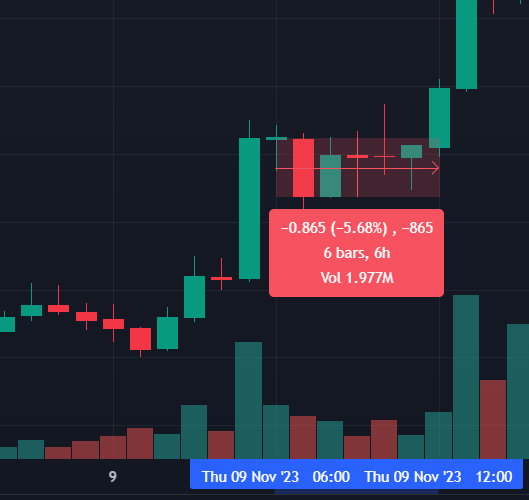
Traders also look at the volume during the flag phase to provide information on the sell pressure from existing holders. An ideal bull flag setup will have a high amount of volume during the flagpole, and lower volumes during the flag phase - this indicates that there has been a large increase in buy pressure from new buyers, but sellers are as-yet unwilling to offload at current prices. If the flag stage also exhibits large trade volumes, this may indicate that sellers are more keen to absorb buy-side liquidity at prices at or just below the high of the flagpole - and that buyers are more likely to exhaust themselves before a second leg. Although relative volumes by themselves are rarely used as a trade invalidation, they are still often considered for any potential trade.
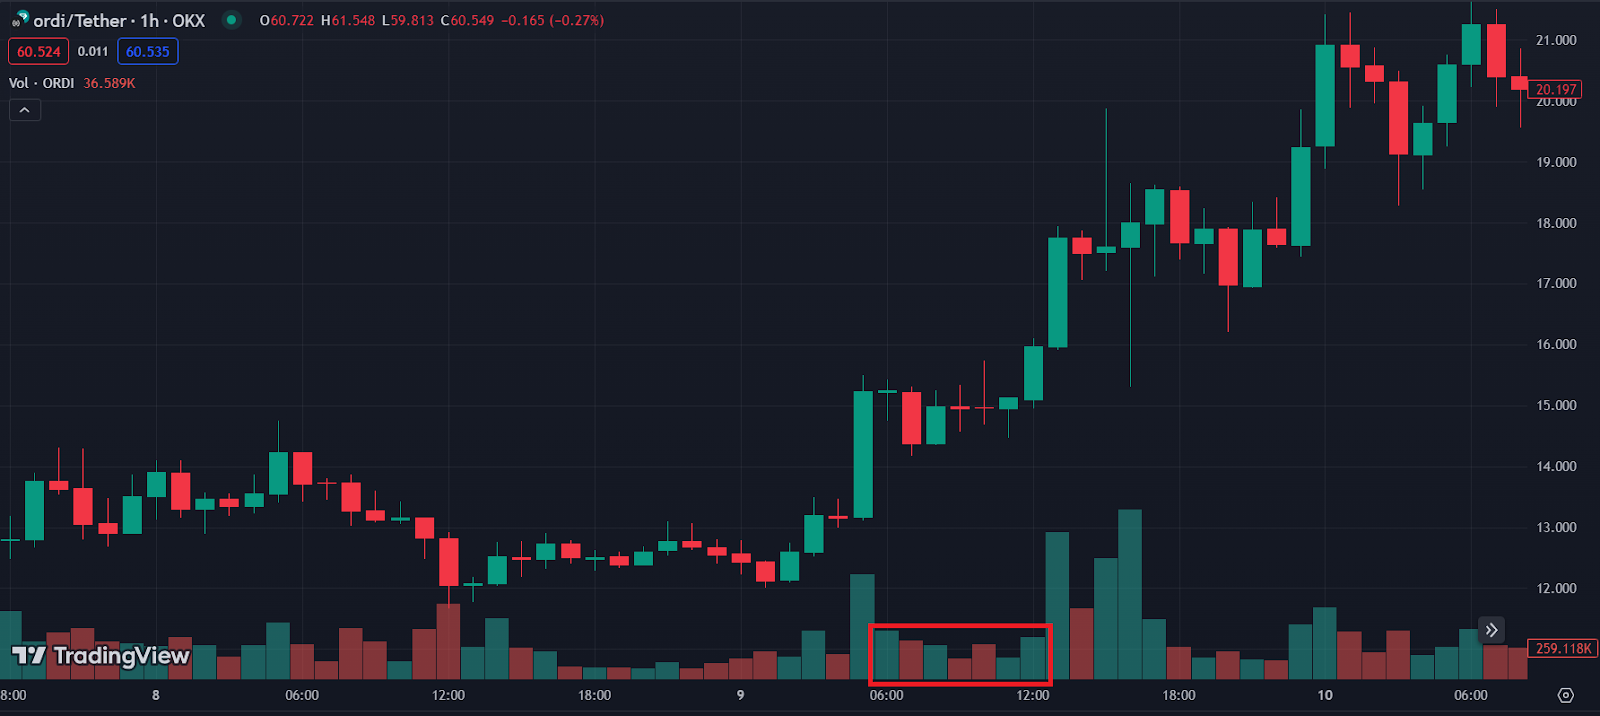
BREAKOUT
At this point, the trader will likely have gauged the initial momentum of the move and looked for indications of weakness or lack of follow-through. If a trader has decided that a move has sufficient momentum for follow-through, they would decide on an entry point that is at or above the breakout from the top of the box marked by the flag. Some traders wait until the top of the flagpole has broken in order to take out a trade - this is individual to each trader, and will also depend upon what kind of timeframe the trader is acting upon - for instance, shorter timeframe traders may wish to wait for more confirmation of their position in order to secure a higher hit rate across frequent trades.
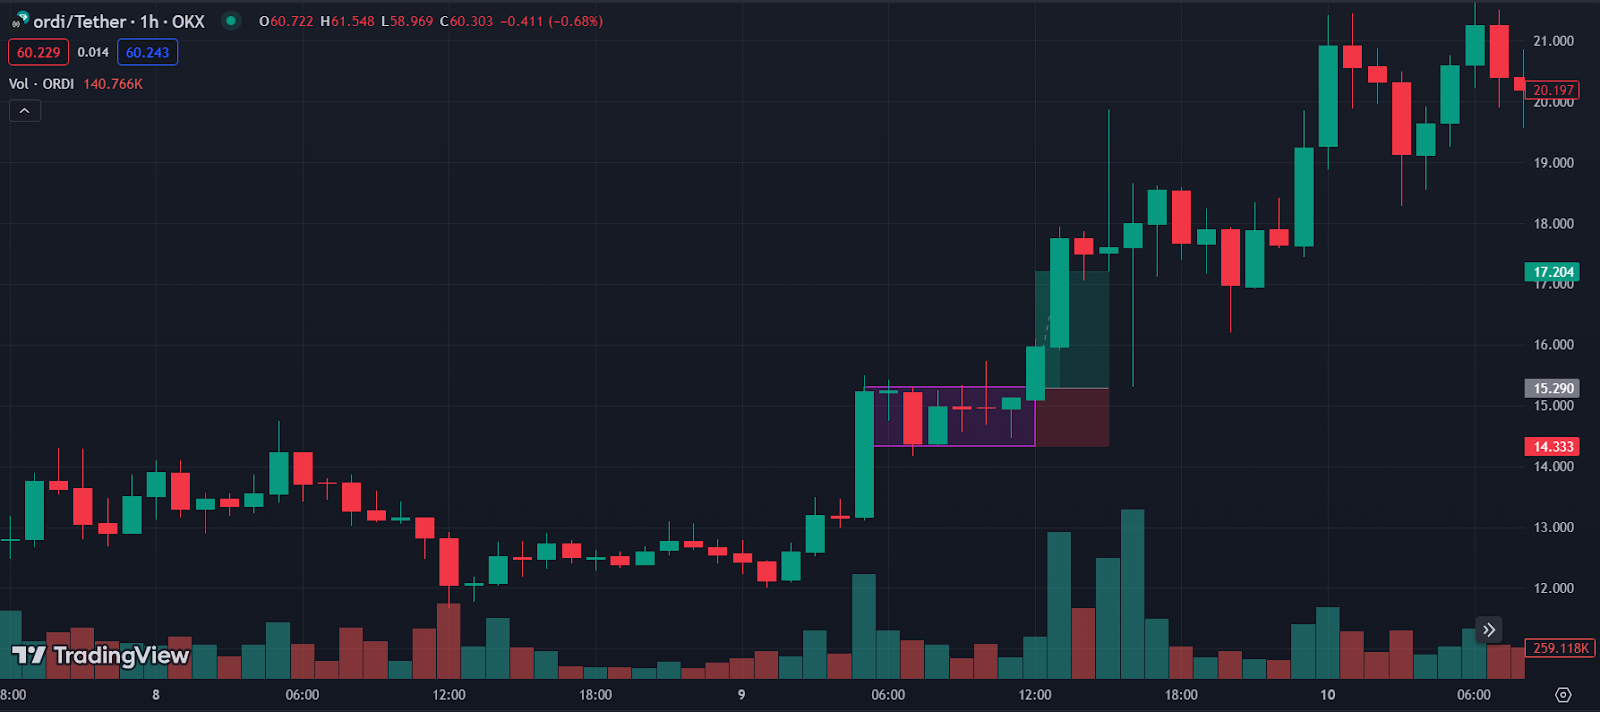
Once the breakout has occurred from a bull flag, the trader would take out a long position in order to capitalize on continuation. Depending on the prior information that the trader has received from the flagpole/flag phases, as well as the relative volumes and drawbacks, the trader will aim for a take profit point according to their preferred risk/reward ratio. As an example, a trader may aim for a 2:1 risk-reward ratio - this means that they set a take profit order at 2x the distance from their entry compared to the distance from entry to stop loss. Traders generally set a stop loss at or just below the lows of the flag structure, as a retrace to this point would generally be considered a failure of the flag pattern.
CASE STUDY: BULL FLAG
30 MINUTE TIMEFRAME: SOLS BREAKOUT
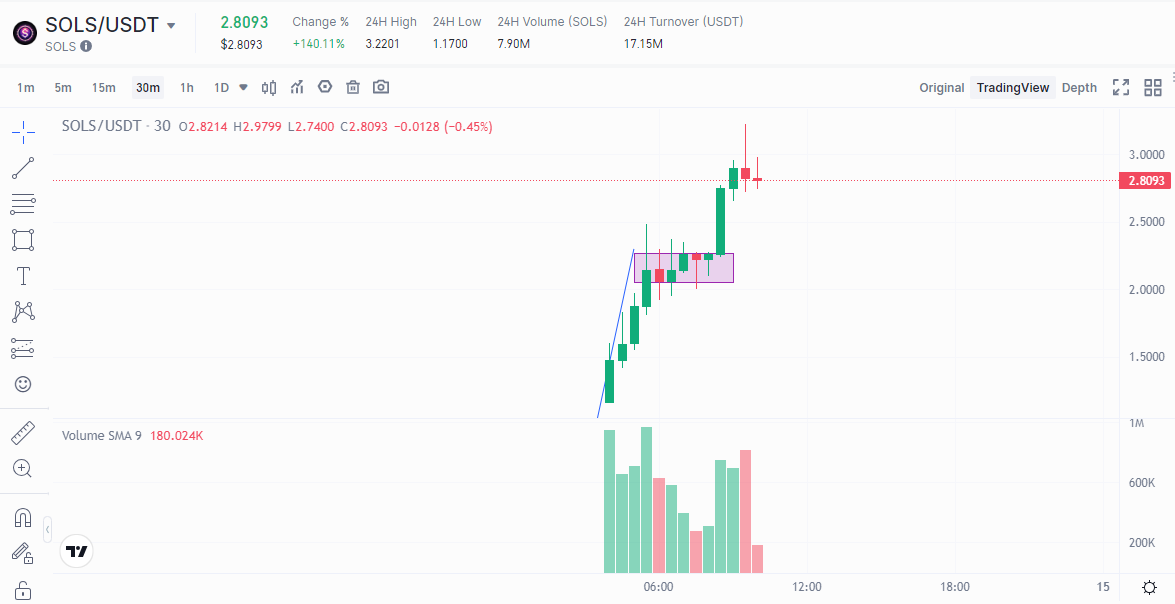
Often, new liquidity entering a coin on venues such as new exchanges can often create bull flags - as a large pool of new buyers are competing for an initial entry on a newly-tradeable coin.
SOLS experienced this in the first few hours of its listing on Gate.io , and a bull flag can be clearly seen on the 30m chart. The initial listing resulted in a high-volume initial surge of buy pressure - which then retraced slightly as price consolidated at around $2, a few hours after its listing. Traders who noticed this may have chosen to identify a flag pattern, and watched the chart for continuation. The price broke out of the flag box after 5 candles of lower-volume trading, and continued upwards towards $3.
CASE STUDY: BEAR FLAG
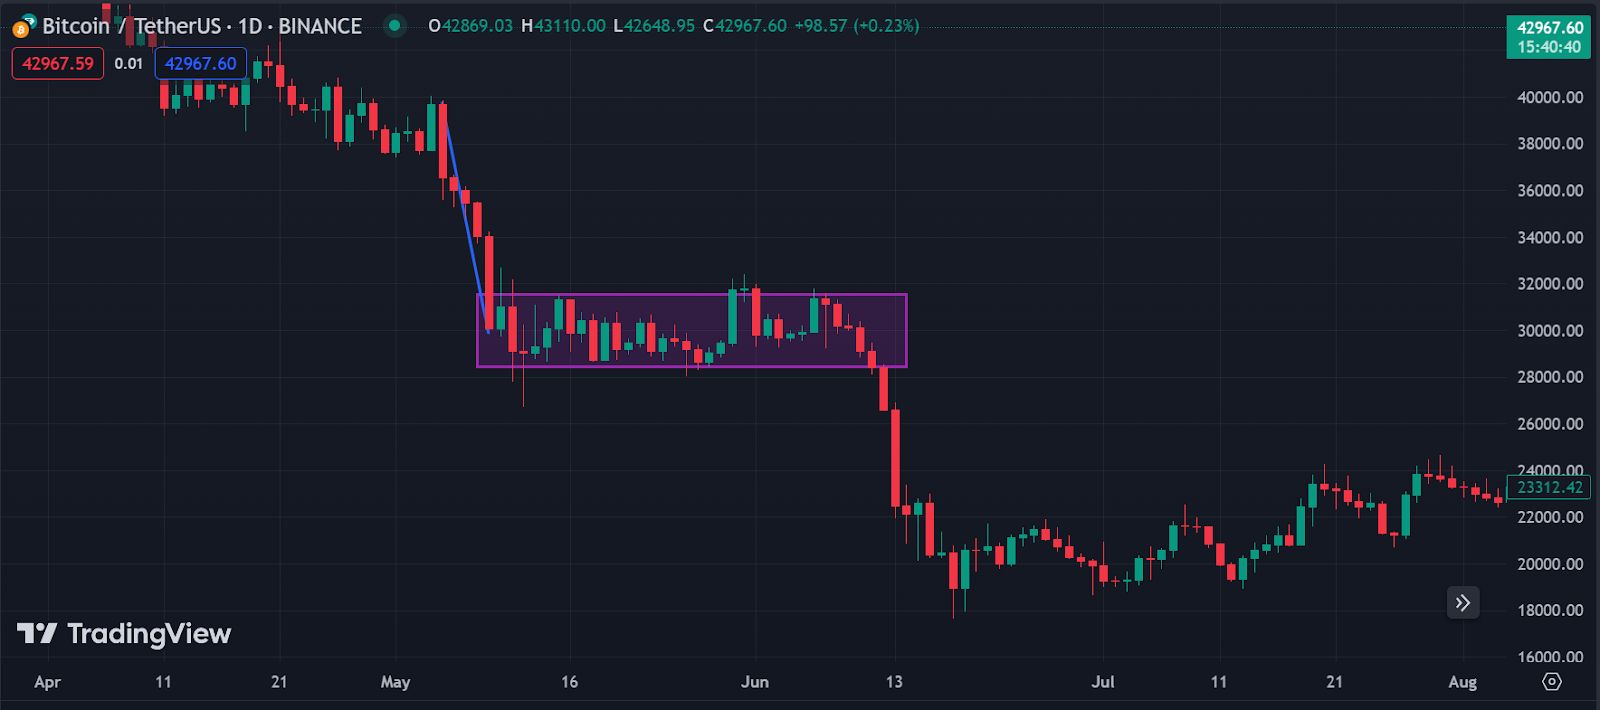
BEAR FLAG ON BITCOIN: MAY 2022
This bear flag occurred on a longer timeframe than the previous bull flag - across multiple weeks. This flag structure is unique in that it also features a failed breakout to the upside, in the final days of May.
Bitcoin initially saw a high-volume downwards spike in early May 2022, which led to an uncertain period of consolidation around a month long. Within that time, the price attempted to breakout to the upside, but only briefly closed outside the flag box before re-entering it 2 days later.The re-entry to the flag box was then followed by a breakdown, and another impulse downwards in the next 2 weeks - resulting in a new yearly low for BTC’s price.
DIFFERENT TYPES OF BULL/BEAR FLAGS
There are a number of patterns that may result from an initial flagpole, or volume spike. The difference between bull and bear flags, and other chart patterns such as pennants, is principally to do with the shape of the flag structure after the initial spike in trading volume.
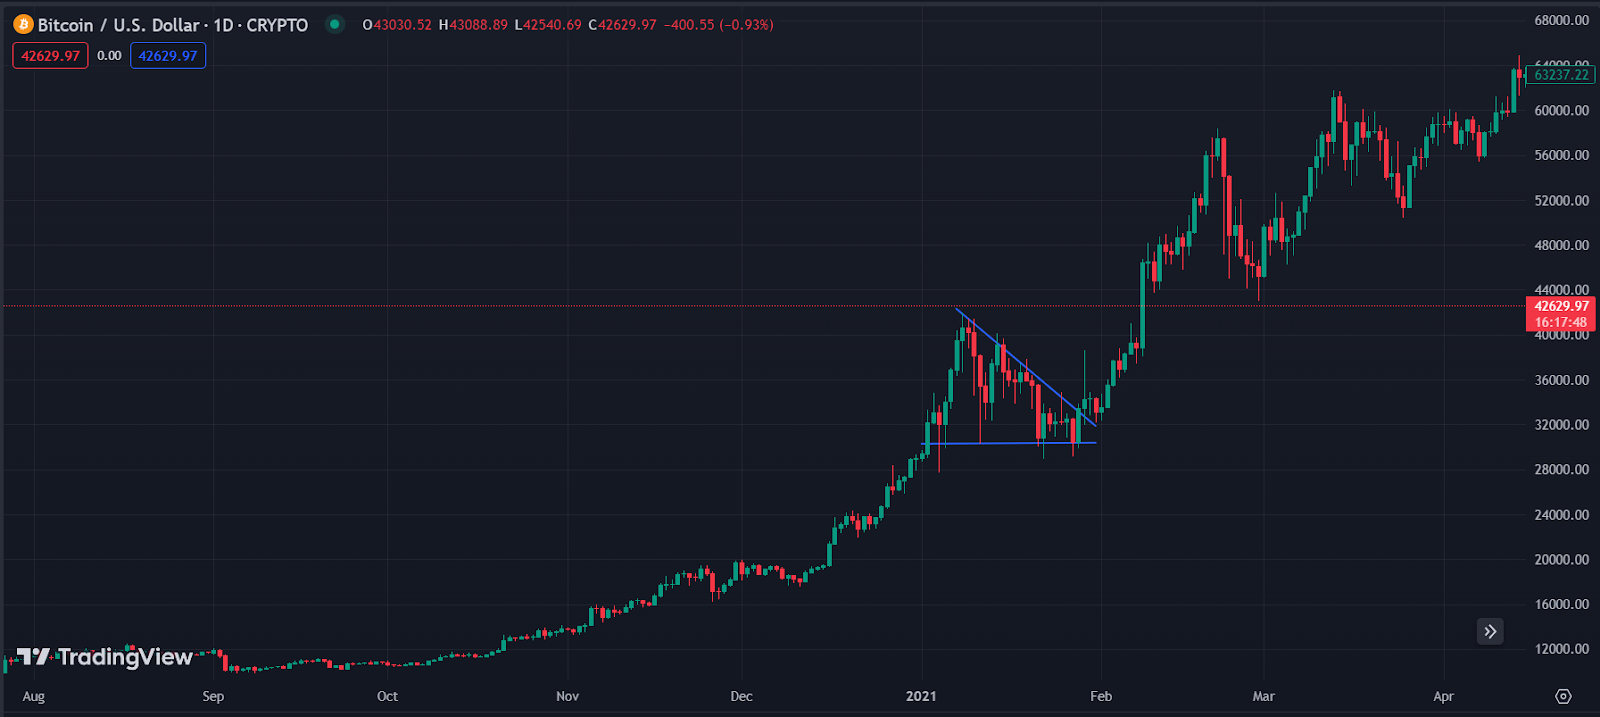
For example, a very similar pattern often confused with the bull flag is known as the bull pennant. A bull pennant represents the same kind of momentum as a bull flag - but rather than consolidating within a horizontal rectangle or a downwards-facing parallelogram, a bull pennant consolidates within a triangular pattern towards a single point. This means that the ‘breakout’ actually occurs far earlier than the bull flag - and can be traded off in a different manner. For instance, a trader trading a bull flag will typically have to wait for a breakout from the flag structure, and some conservative traders will actually wait until the price has reached the high set by the flagpole.
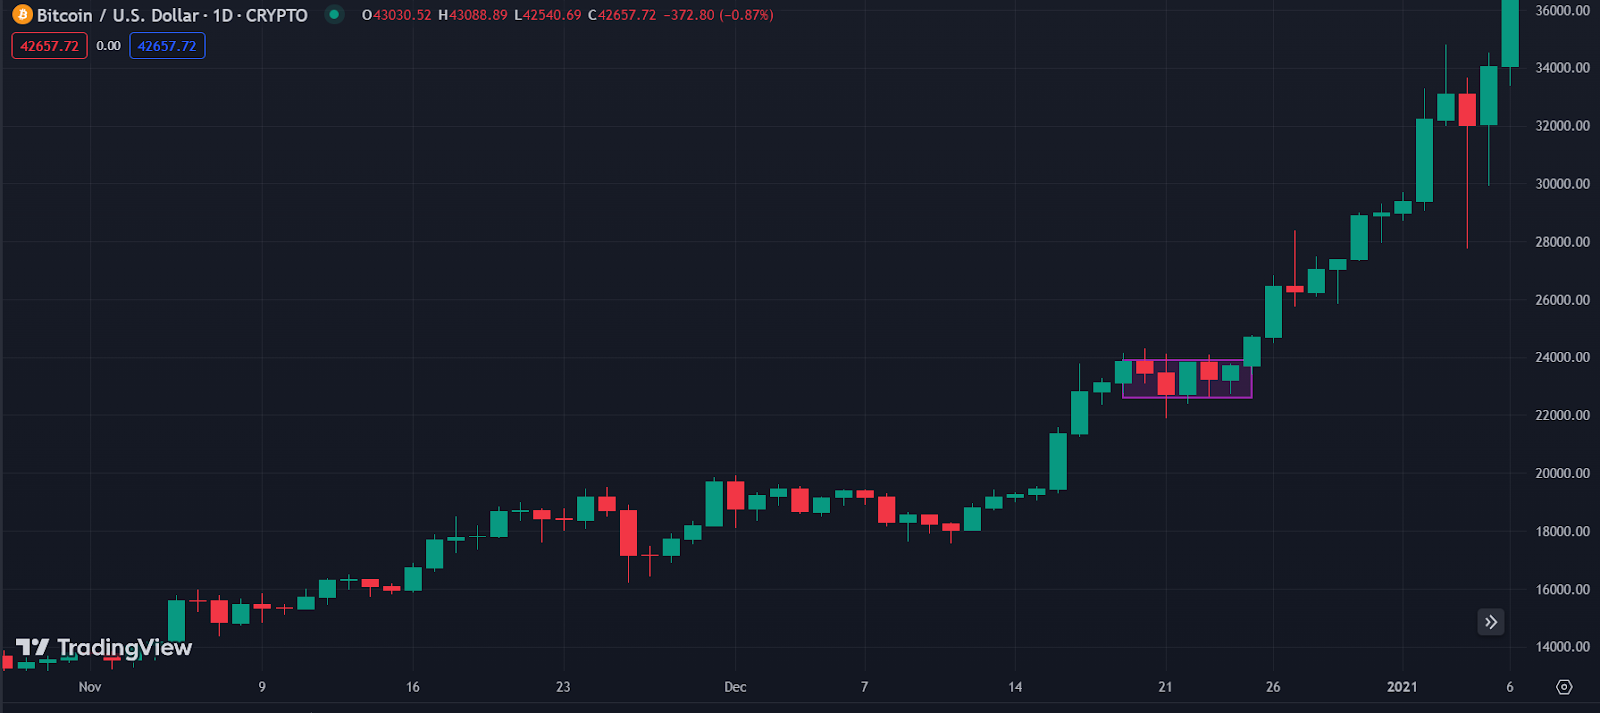
However, a pennant represents a more aggressive structure for traders to trade from. Since the pennant structure narrows to a single point, traders usually take positions as soon as the diagonal line on the top is broken - this is typically far earlier than a flag trader would be willing to enter. This is because in a flag structure, the price would still be within the horizontal box representing the flag - and would not be seen to have broken out.
HOW RELIABLE IS A BULL FLAG PATTERN?
A bull flag is a very well-known chart pattern in mainstream technical analysis, and is often used by new traders and veterans alike to identify potential points of continuation in bullish momentum. Since the flag pattern depends upon an initial spike in price or volume, one of the most common mistakes for new traders to make is to over-eagerly identify these patterns where a flagpole is not actually present. Anew trader who has just learned what a bull flag is, may be overly enthusiastic to find some instances of this chart pattern, leading them to misidentify slight upwards movements as the flagpole for a bull flag, where in fact a sufficient level of upwards momentum is simply not present.
It may also lead them into disregarding market structure in their eagerness to put theory into practice - for instance, by identifying a brief retrace during a bearish trending market as the start of a bull flag.
This is why traders typically watch for and study the invalidation points of a bull flag pattern - and set a plan to follow before trading.
WHAT INVALIDATES A BULL FLAG?
A bull flag can be invalidated by many different factors at many different points during a trade. For instance, some traders may invalidate a bull flag set-up before they take the trade e.g. if the flag is forming incorrectly, or if the initial retraces are too deep.
Insufficient volume or upwards momentum on the initial flagpole may also indicate a lack of initial bullish momentum, which would mean that a trader would likely not consider this as a potential bull flag setup.
A deep retrace from the initial flagpole may indicate the lack of follow-through buy pressure, or indicate that the initial flagpole’s move was made on low liquidity. If early buyers are overly keen and are excessively sold into, this may indicate the lack of follow-through momentum. Traders will often decide upon a certain % retrace as an invalidation of their trade setup.
Additionally, high volume in the consolidation phase is not usually used by traders as a concrete invalidation of their trade strategy, but will sometimes indicate that sellers are keen to engage with a certain price level, and may suggest presence of lingering sell pressure.
Price exiting the flag to the downside is typically the most common reason for invalidation of a certain trade - if the price fails to break out of the flag and instead retraces to the bottom of the flag’s range, traders will often consider this a failed breakout and a signal to cut any trade that they have attempted to execute so far.
CONCLUSION
Bull and bear flags are among the most common chart patterns used by technical traders, as they frequently appear in trending markets on assets that are experiencing momentum. Of course, the fact that bull and bear flags are common and popular chart patterns for traders to engage with means that larger market participants may understand the likely presence of traders’ stop losses or liquidation points, and trade on this information in a predatory manner, at the expense of traders using the chart pattern to inform their decisions. Many traders also use on-chain analysis to augment their technical analysis. On-chain analysis, such as a particularly large funds transfer to or from an exchange, can also be used to validate or invalidate a forecast based on chart patterns.
Traders can try Arkham to familiarize themselves with on-chain data track prominent tokens like ETH to look for on-chain movements alongside an emerging chart pattern to assist them in validating their analysis. Read Arkham's Guide to On-Chain Analysis.
Disclaimer: The content of this article solely reflects the author's opinion and does not represent the platform in any capacity. This article is not intended to serve as a reference for making investment decisions.
You may also like
DoraHacks officially launches BUIDL AI, opening automated payment service for hackathons
TRON Breaks Key Resistance, Eyes Additional 450% Price Increase
Obol Collective may launch OBOL token on May 15